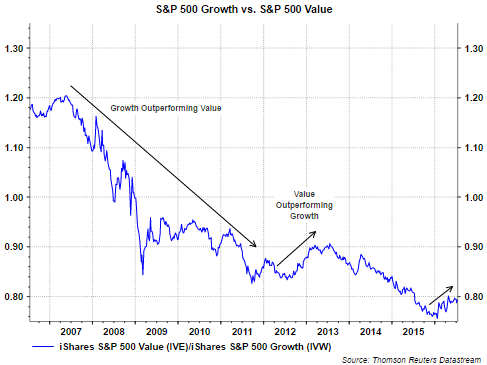
Over the course of the past few years several times I have touched on the significance of the value versus growth stock performance cycle. A couple of the earlier articles contain useful information for investors that provides insight into the economic cycle being telegraphed by the value/growth cycle. In short, in a slowing economic environment, growth tends to outperform value and the opposite tends to occur when the economy is strengthening. Value has been outperforming growth this year.

In the March 2014 article, Why It Matters That Value Stocks Are Outperforming Growth Stocks, value's outperformance peaked around April of that year and growth went on a nearly two year run of beating value. The backdrop for this reversal from value to growth is provided in the just noted article, but economic data began to rollover. In an article early this year, Is The Value Style Outperformance Sustainable?, detail is provided on the trend reversal in 2014 from value back to growth as well as value's strength now.
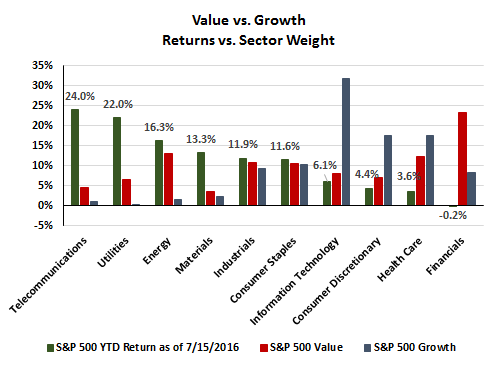
Fast forward to today and the iShare equivalent of the S&P 500 Value Index is outperforming the S&P 500 Growth Index, 9.21% versus 4.79%, respectively. A significant factor contributing to value's strength is the investor focus on income producing equities in a world where bond rates are near low, near zero and in some cases below zero. The below graphic compares the sector weights of the S&P 500 Value and Growth indices. The two top performing sectors this year are telecoms, up 24% and utilities, up 22%. Combining these two sectors, telecoms plus utilities, they have a weighting of 11.2% in the value index and only 1.3% in the growth index. Additionally, in each of the six top performing sectors, value's sector weighting is greater than in growth's. 
Positively, the next three best performing sectors, energy, materials and industrials, tend to be economically sensitive ones. And, if one believes the equity market serves a bit like a weighing machine, the better performance in these three sectors may just be anticipating a better economic environment ahead.
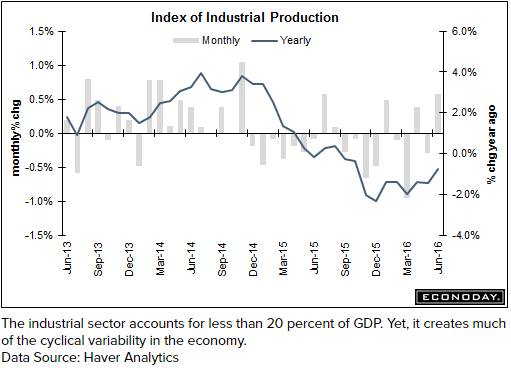
Friday's industrial production report for June of .6% was better than the high end consensus expectation. The report contained many positives signalling an improving manufacturing sector, retail sales exceeded expectations (.6% vs .1% consensus) and jobless claims of 254,000 were lower than the 265,000 consensus.

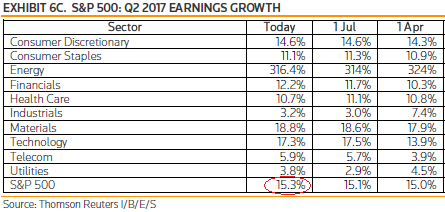
With earnings projected to improve as one looks one year forward and economic activity just maybe swinging more positive, there remains the possibility that value's outperformance might last more than just a few quarters this time around. The one concern is the overvaluation of some of the income yielding sectors like utilities; however, investors may still find attractive values in the the more economically sensitive sectors.

