🎁 💸 Warren Buffett's Top Picks Are Up +49.1%. Copy Them to Your Watchlist – For FreeCopy Portfolio

Valuation Rubber Band: S&P 500 Vs Gold Miners

Published 07/15/2014, 01:54 AM
Updated 07/09/2023, 06:31 AM
US500
-
GC
-
SI
-
PL
-

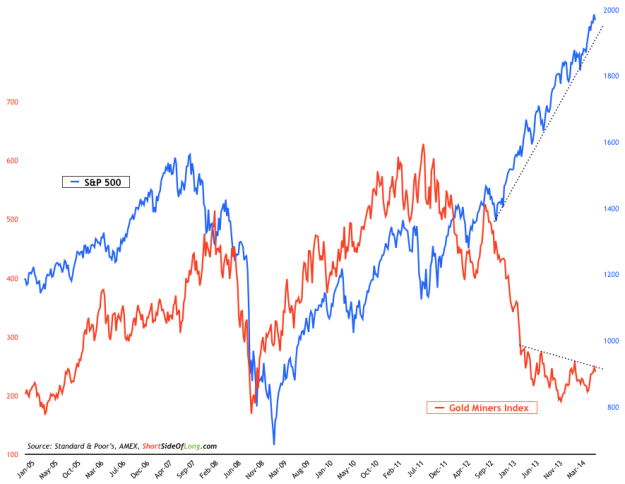
Chart 1: S&P 500 marches higher, while Gold Miners keep consolidating

S&P 500 vs Gold Miners Index

The Precious Metals sector suffered a strong reversal yesterday, as last week's breakouts were quickly given back across the board. Gold fell by 2.4%, Silver by 2.5%, Platinum lost 1.2% and Gold Miners declined by 2.5%. The chart above shows the ongoing valuation rubber-band stretch between the overall US equity market and the Gold Mining sector, without any major trend change.

From the technical perspective, I have drawn two simple trend lines. These don’t have to mean much, but let us assume for a second that they represent current trends. From this assumption we can observe that until the S&P 500 breaks down below its trend line, bulls will remain in charge. On the other hand, until Gold Miners can stage a proper breakout above its neckline, bears remain in charge.

Latest comments

Loading next article…
Risk Disclosure: Trading in financial instruments and/or cryptocurrencies involves high risks including the risk of losing some, or all, of your investment amount, and may not be suitable for all investors. Prices of cryptocurrencies are extremely volatile and may be affected by external factors such as financial, regulatory or political events. Trading on margin increases the financial risks.
Before deciding to trade in financial instrument or cryptocurrencies you should be fully informed of the risks and costs associated with trading the financial markets, carefully consider your investment objectives, level of experience, and risk appetite, and seek professional advice where needed.
Fusion Media would like to remind you that the data contained in this website is not necessarily real-time nor accurate. The data and prices on the website are not necessarily provided by any market or exchange, but may be provided by market makers, and so prices may not be accurate and may differ from the actual price at any given market, meaning prices are indicative and not appropriate for trading purposes. Fusion Media and any provider of the data contained in this website will not accept liability for any loss or damage as a result of your trading, or your reliance on the information contained within this website.
It is prohibited to use, store, reproduce, display, modify, transmit or distribute the data contained in this website without the explicit prior written permission of Fusion Media and/or the data provider. All intellectual property rights are reserved by the providers and/or the exchange providing the data contained in this website.
Fusion Media may be compensated by the advertisers that appear on the website, based on your interaction with the advertisements or advertisers.
© 2007-2024 - Fusion Media Limited. All Rights Reserved.