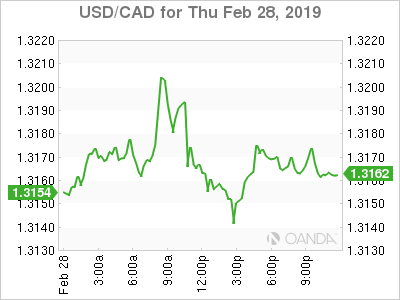
The Canadian dollar is flat against the U.S. dollar on Thursday. The loonie is trading at 1.3158 ahead of the monthly GDP release to be published on Friday morning. The currency stood its ground versus the greenback despite disappointing data. The Canadian current account deficit was wider than expected and raw material prices were weaker than expected at 3.8 percent.
The Bank of Canada (BoC) will be one of the highlights of next week, but it’s not expected to raise its benchmark rate above 1.75 percent. The Fed pausing its rate hike path and global growth concerns, give the BoC some room for patience.
Oil prices were mixed as the North American benchmark rose still impacted by a surprise drawdown in weekly inventories in the U.S.
The resurgence of the U.S. dollar and the potential downside risks for oil prices will put pressure on the Canadian dollar next week. Only a hawkish assessment of the economy by Governor Poloz could relieve some of that pressure, but a soft GDP data point could take that off the table.
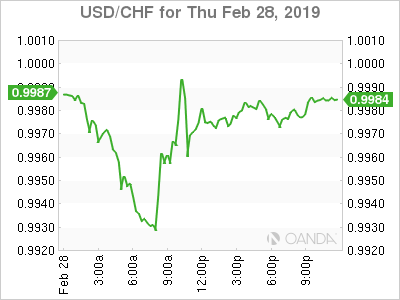
The U.S. dollar is higher against most major pairs. The greenback has appreciated against the GBP JPY, NZD and AUD, but is flat against the CAD and has depreciated against the CHF and the EUR.
Gold Lower on Strong US Data and Higher Safe Haven Appeal of Swiss Franc
Gold fell 0.44 percent on Thursday after a strong U.S. GDP and with India and Pakistan tensions easing with the expected release of an Indian fighter pilot reducing the appetite for the metal as a safe haven. Investors looking to hedge exposures went looking instead to the Swiss franc.

The resurgence of the U.S. dollar was in part thanks to the first estimate of growth in the fourth quarter. The Q4 GDP capped a 2.9 percent growth for the U.S. in 2018. While there are some dark clouds setting on the horizon for the U.S., the data dependant Fed could bring back at least 1 rate hike this year.
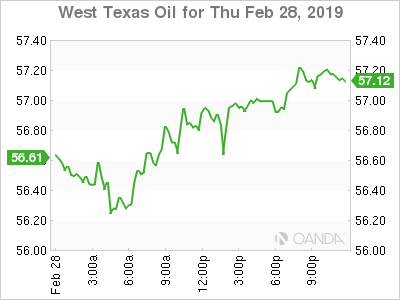
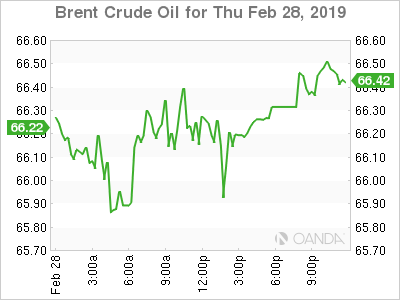
Mixed Global Economic Data Begets Mixed Crude Benchmarks
WTI rose 0.42 percent while Brent is flat after yesterday’s surprise drawdown in U.S. weekly crude inventories and the Chinese factory activity dropped to a 3-year low. Oil stocks fell 8.65 million barrels when the market was expecting a rise of 2.8 million. West Texas Intermediate is still down 0.16 percent on a weekly basis with crude lower with a 1.18 percent loss.
U.S. President Trump’s tweet warning OPEC to relax caused a massive drop in both benchmark, but as economic data in the U.S. has remained strong with baked in demand for energy forecasted higher, the American benchmark is closer to rebounding.
Saudi Arabia responded to Trump and no immediate change is expected as OPEC+ will continue to limit production seeking to stabilize prices.
The producers that are part of the agreement have given no signs that they are ready to reassume normal production, but there are concerns on how long they can keep limiting their revenue.
Despite positive trade news as the U.S. and China appear near an agreement to end their tariff feud, there are still lots of unknowns on what the deal will look like. Global growth estimates have been slashed as the two largest economies engaged in a trade war.
Supply disruptions will continue to boost prices, but once those are priced in there is little to suggest global energy demand is on the mend, putting more pressure on crude going forward.
Slow Brexit News Day Gives Way to Profit Taking
The pound lost 0.34 percent on Thursday, but so far this week the currency has advanced 1.63 percent on the back of higher chances of avoiding a no-deal Brexit. The lack of information brought about a bout of profit taking until there are more news to price into the currency.
European leaders have given strong hints that an extension could be in the cards, but as much as those comments have eased some concerns, they are merely delaying what now seems inevitable. All scenarios are still on the table, and they have the backing of certain groups that will fight to the end making the prospect of an orderly exit almost impossible.

Theresa May’s cabinet continues to lose members who disagree with her strategy putting into evidence the difficulty of reaching a compromise within the U.K., let alone with the EU.
Swiss Franc Rises on Safe Haven Flows
The Swiss franc rose 0.41 percent as investors were looking to the currency as a safe haven. Soft Chinese factory activity, tensions between India and Pakistan, the collapse of the U.S.-North Korea summit and the lack of progress on the U.S.-China trade negotiations are amplifying market anxiety.