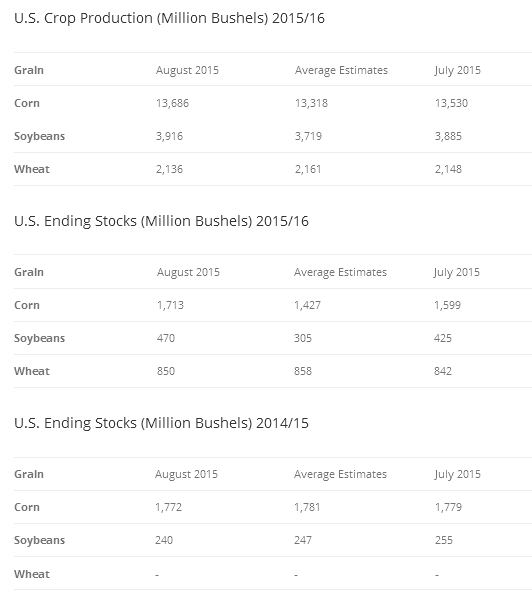
Corn production for 2015/16 was unexpectedly increased by the USDA to 13.686 billion bushels, 2.76% greater than pre-report expectations. The August USDA World Agriculture Supply and Demand Estimates (WASDE) report is the first of the year that uses survey-based estimates to calculate area, yield and production information. The increased production estimates of 13,686 million bushels for corn and 3,916 million bushels for soybeans, increased 2015/16 ending stocks higher for both crops, and decreased their projected season-average price, both falling $0.10. U.S. wheat production decreased a meager 12 million bushels. Decreasing winter wheat production estimates slightly offset increasing spring wheat production.
Corn
The USDA estimated U.S. corn production for the 2015/16 crop season at 13.686 billion bushels in the August WASDE report, a 156 million bushel increase from the July report, but a 368 million bushel increase from the average estimate of industry analysts. The increased production estimates caused the national yield average to increase to 168.8 bushels per acre, a 1.2% increase from July’s trend-based estimate. Planted and harvested acres were unchanged from last month.
Corn ending stocks for 2015/16 were increased 114 million bushels, to 1,713 million bushels. Ending stocks were forced up by the increase in expected production, which easily offset the expected increase in corn usage. The projected season-average price range for corn in 2015/2016 was projected at $3.35 to $3.95 per bushel.
World corn production for 2015/16 was projected at 985.61 million tons, a 5.5 million ton decrease form last month due to lower expected production from China, the E.U., and Serbia, which were partially offset by increases reported from Brazil, Ukraine, and Russia.
Soybeans
U.S. soybean production for 2015/16 was also reported above analyst expectations at 3.916 billion bushels, a 31 million bushel increase from last month. Production increased despite a 0.9 million acre decrease in the harvested acres estimate, mainly due to lower harvested acreage expected in Missouri. The average U.S. soybean yield was projected at 46.9 bushels per acre, a 0.9 bushel per acre increase from last month. Ending stocks for 2015/16 were estimated at 470 million bushels, a 45 million bushels increase from last month due to the expected increase in production and decreased exports due to competition from Brazil and Argentina. The U.S. season-average price forecast for soybeans in 2015/2016 was projected at $8.40 to $9.901 per bushel.
Global soybean production was projected at 320.05 million tons for 2015/16, a 1.1 million ton increase from last month due to higher production reported form the U.S. and Ukraine.
Wheat
Estimated U.S. wheat production for 2015/16 was decreased by 12 million bushels to 2,136 million bushels due to decreasing winter wheat production estimates more than offsetting increases in spring wheat production expectations. Ending stocks for 2015/16 increased 8 million bushels to 850 million, the highest level since 2010/11. The projected 2015/2016 season-average price was reported at $4.65 to $5.55 per bushel.
Global wheat production for 2015/16 was increased 3.59 million tons to 726.55 million tons, a record if realized. Production increases reported from the Black Sea region and the U.S. more than offset decreases reported from the E.U. and Canada.
Outlook
Corn and soybean prices will struggle under the unexpected increase in 2015/16 production. The decrease in their respective prices may improve corn and soybean export and sales data, which has been waning over the past few weeks. The weather forecasts for major corn growing areas remains positive the next several weeks, doing little to possibly debunk the higher yield expectations reported today.
Next week, the Pro Farmer Midwest Crop Tour begins. August is marked with many farm tours, but the publicity of this particular tour and its subsequent report does allow it to move the market. Those farmers and traders hoping for some upside price relief should keep an eye on the report, specifically the results coming from the eastern Corn Belt.
The data from this report was taken from the August 12, World Agriculture Supply and Demand Estimates report released by the USDA Office of the Chief Economist. All area, yield, and production data was collected by the National Agricultural Statistics Service (NASS) and is based on the responses of farmers surveyed during the prior month. All foreign data is collected by the Foreign Agriculture Service (FAS) attaché report and analysis of foreign commodity developments.

