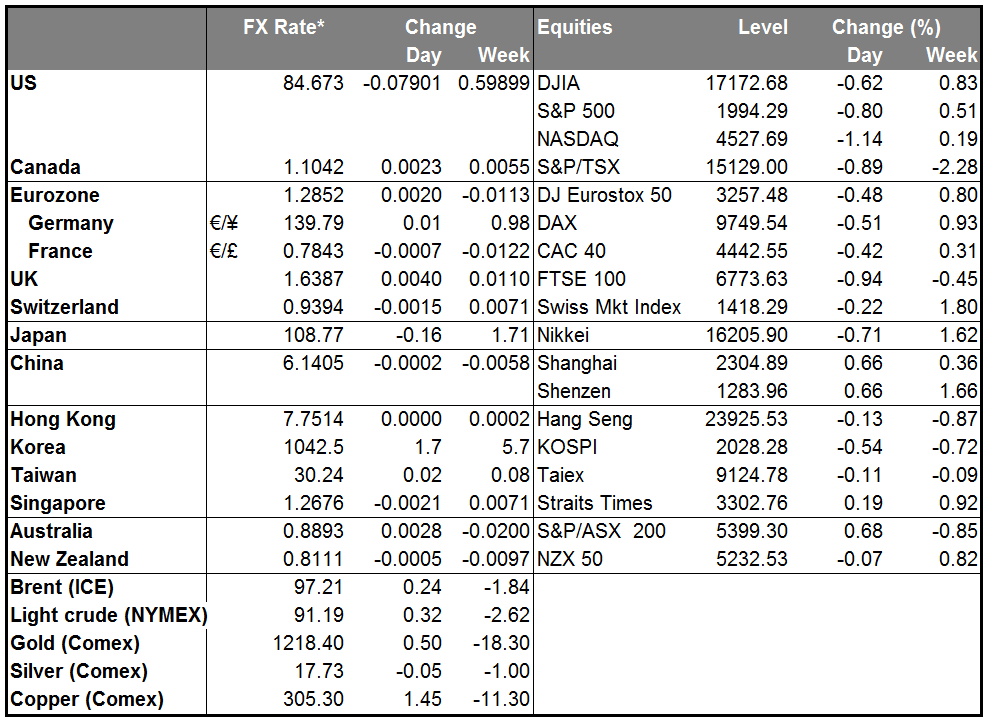
The DXY index, which measures the dollar’s value against a basket of six currencies, has been up for 10 consecutive weeks. This is the first time since the dollar was floated in 1971 that that has happened, according to my former colleagues at Deutsche Bank. They calculated that there have only been nine consecutive weeks of DXY gains three times: in 1997, 1979 and 1975. After the 1996-1997 streak ended, the DXY corrected slightly for one week and then rallied to new highs. However after the nine-week streak in 1979, the index fell for nine consecutive weeks. So all we can tell from looking at past examples is that the dollar will either go up or down from here – not particularly useful information.
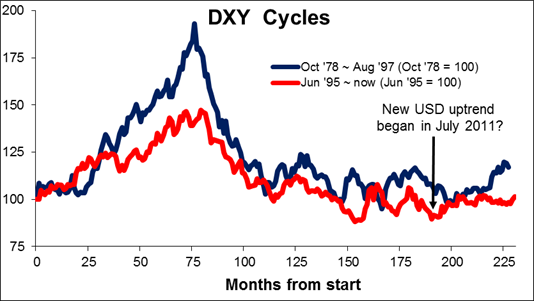
I prefer to look forward, and looking at the fundamentals, I think the dollar is still at the beginning of a new long-term up cycle. This is because of the divergence in macroeconomic performance and therefore monetary policy between the US and the other major economies. Comments by ECB and Fed officials yesterday illustrate that point. ECB President Draghi said the Eurozone economy was losing momentum and that the ECB stood ready “to use additional unconventional instruments” and to “alter the size and/or the composition of our unconventional interventions” if it becomes necessary. On the other hand, New York Fed President Dudley and Minneapolis Fed President Kocherlakota both warned about the dangers of raising interest rates too early. "You have to make sure when you raise rates, that the economy can take it," Dudley said, while at the same time suggesting that he would be happy with a rate rise next year. In other words, the risk in the Eurozone is that policy may have to be loosened further, while the risk in the US is that policy may be tightened too early. These two views crystalize the divergence in monetary policy that is likely to keep the dollar rising, in my view.
In contrast, Canadian monetary policy became a bit more opaque yesterday. Bank of Canada Senior Deputy Governor Wilkins said an “underwhelming” global recovery has caused the Bank to lower its estimate for the neutral level of interest rates to 3.0%-4.5%, whereas before the financial crisis it was 4.5%-5.5%. This statement was no different than what the Fed and Bank of England have said too. Nonetheless CAD was the weakest G10 currency over the last 24 hours, perhaps because Wilkins also said she believes the sharp rise in core inflation for August announced last week was “consistent” with the Bank’s July forecast, when BoC said inflation pressures were only temporary. I’m not so sure, and I think market sentiment towards CAD could turn around again to be positive. Today’s levels might prove to be a good entry point for CAD longs, perhaps vs JPY, which was relatively strong overnight and so could weaken again.
Today’s data: Tuesday is a PMI day. Many of the PMIs for September will be announced. During the Asian morning, China’s preliminary HSBC manufacturing PMI unexpectedly rose a bit rather than falling to the 50 line, as was expected. AUD and copper rallied on the news, although AUD remains lower than Monday’s opening European levels. I don’t think the recent modest stimulus in China is enough to prevent the economy from slowing further and I remain bearish on AUD.
The PMIs will take center stage during the European day as well. Eurozone’s preliminary PMIs are released just after the figures for the two largest countries of the bloc, Germany and France, are announced. The figures are expected to show a further slowdown in both manufacturing and service-sector and highlight the deterioration in the Eurozone economy. They could be EUR-negative if there are no upside surprises. From France, we also get the country’s final Q2 GDP and the forecast is for an unchanged print from the preliminary figure.
Later in the day, we get the US preliminary Markit manufacturing PMI for September and the Richmond Fed manufacturing index for the same month. The Federal Housing Finance Agency (FHFA) home price index is also coming out and the forecast is for the pace of increase in house prices slightly accelerate in July.
In Canada, retail sales for July are coming out.
Kansas Fed President Esther George speaks today. She is one of the more hawkish members of the FOMC and should make an interesting contrast to the dovish speech overnight by Kocherlakota, who speaks again today.
The Market
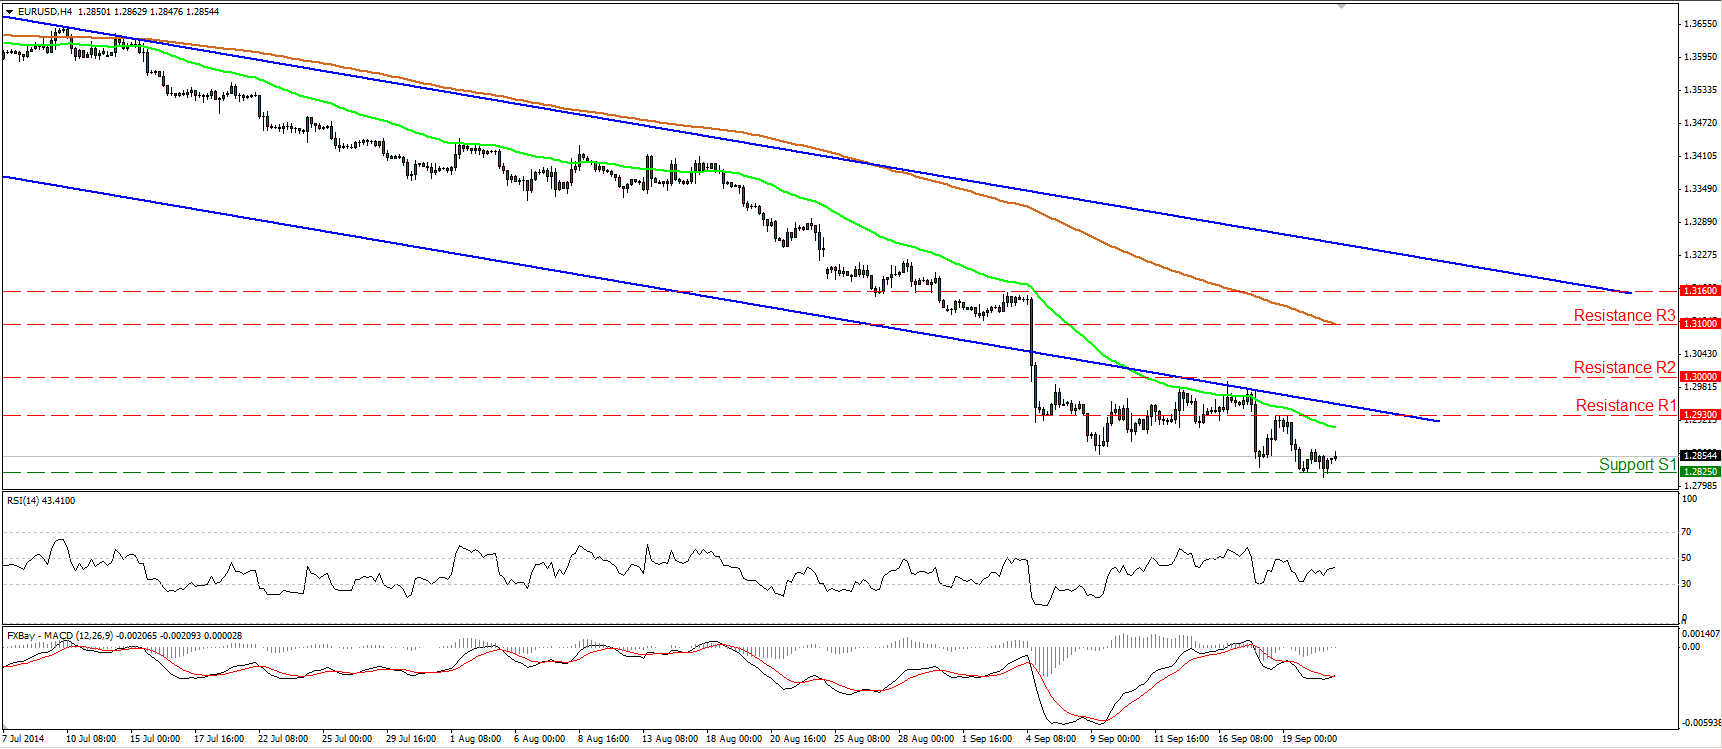
EUR/USD consolidates near 1.2825
EUR/USD moved in a consolidative mode, remaining slightly above the support line of 1.2825 (S1). Zooming in on the 1-hour chart, I still see positive divergence between both of our hourly momentum studies and the price action, which makes me believe that we may see the pair rebounding somewhat. The notion is also supported by our daily momentum indicators. The 14-day RSI moved higher and exited its oversold field, while the MACD crossed above its signal line. However, bearing in mind that the Eurozone’s preliminary PMIs for September are expected to have declined, we may experience the next leg down earlier than the technical picture points to at the moment. On the daily chart, the price structure remains lower highs and lower lows below both the 50- and the 200-day moving averages, thus I will stick the view that the overall picture remains negative and I would see any possible bullish waves as corrective moves and renewed selling opportunities. I would wait for a decisive move below 1.2825 (S1) to open the way for the key zone of 1.2760 (S2).
• Support: 1.2825 (S1), 1.2760 (S2), 1.2660 (S3).
• Resistance: 1.2930 (R1), 1.3000 (R2), 1.3100 (R3).
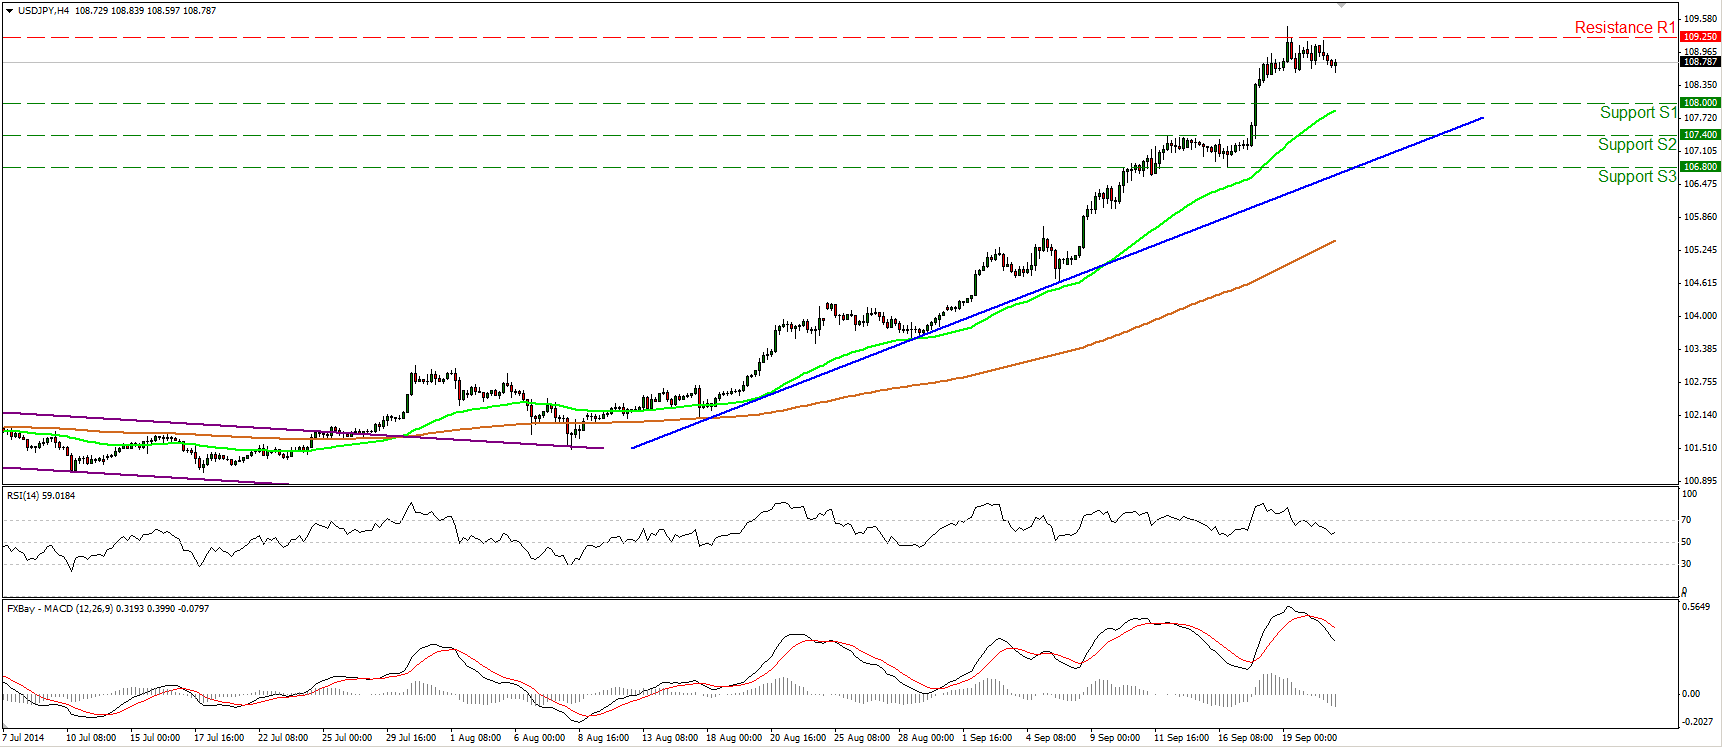
USD/JPY in a consolidative mode below 109.25
USD/JPY remains in consolidative mode, slightly below the resistance zone of 109.25 (R1). As long as the price is trading above the blue uptrend line and above both the moving averages, I consider the near-term bias to be to the upside. However, I would be mindful of a possible pullback before the next leg higher. The RSI declined further after exiting its overbought zone, while the MACD topped and moved below its signal line. In the bigger picture, I still see a newborn long-term uptrend, since, after the exit of a triangle on the daily chart, the price structure remains higher highs and higher lows above both the 50- and the 200-day moving averages.
• Support: 108.00 (S1), 107.40 (S2), 106.80 (S3).
• Resistance: 109.25 (R1), 110.00 (R2), 110.70 (R3).
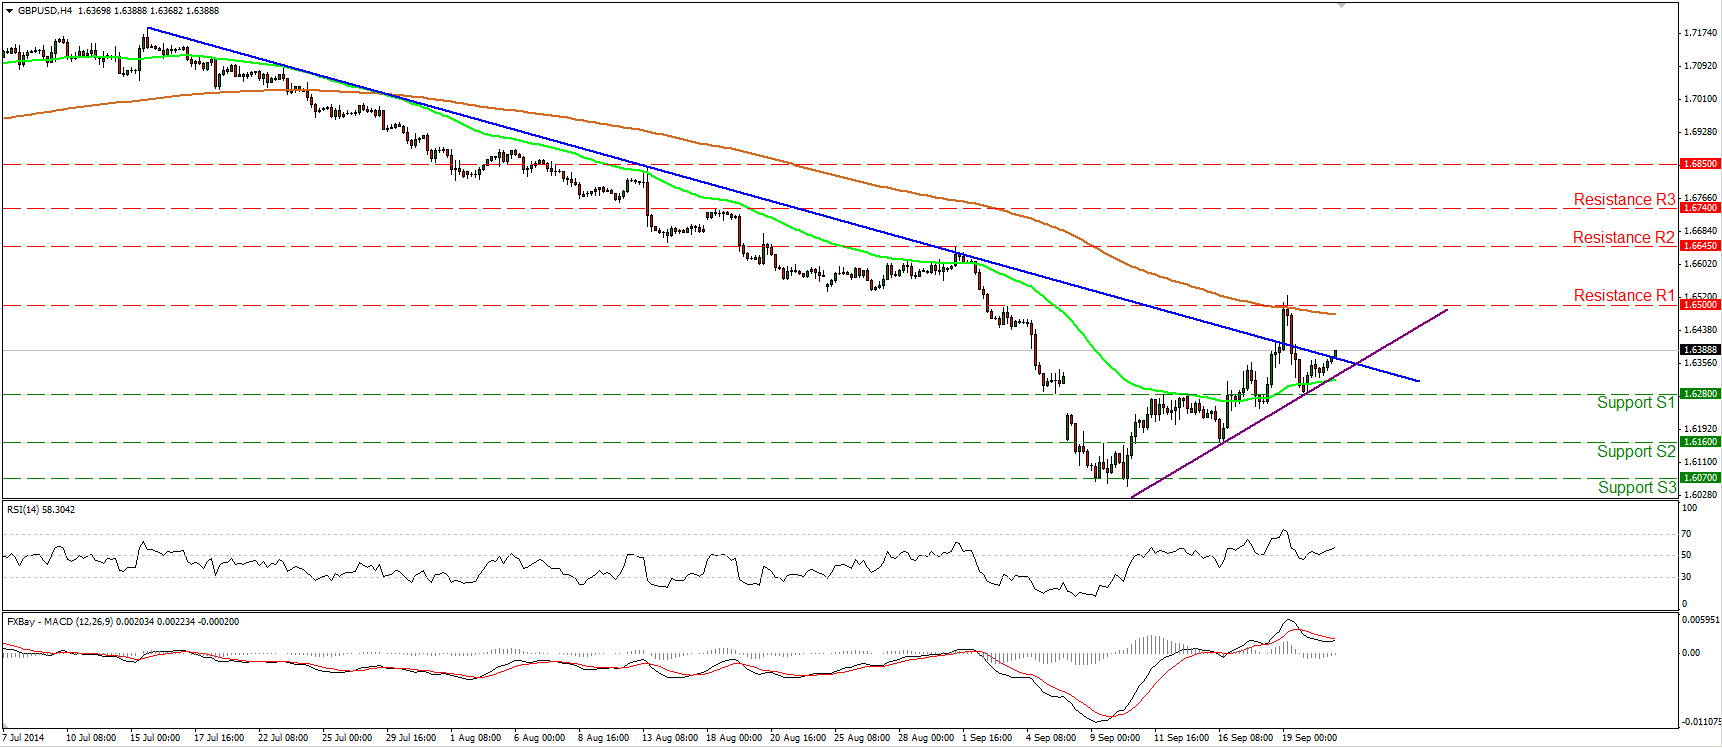
GBP/USD rebounds from 1.6280
GBP/USD moved higher after finding support at 1.6280 (S1). Although this signals a higher low and keeps the near-term bias cautiously to the upside, I would wait for a clear move above 1.6500 (R1) to trigger further upside extensions. Such a move would signal a forthcoming higher high and is likely to find resistance near the area of 1.6645 (R2), which coincides with the 80-day exponential moving average. On the daily chart, the 14-day RSI moved higher and is now getting closer to its 50 line, while the MACD has bottomed and crossed above its trigger. This amplifies the case that we may see further upside in the near future, at least another test near 1.6500 (R1).
• Support: 1.6280 (S1), 1.6160 (S2), 1.6070 (S3).
• Resistance: 1.6500 (R1), 1.6645 (R2), 1.6740 (R3).
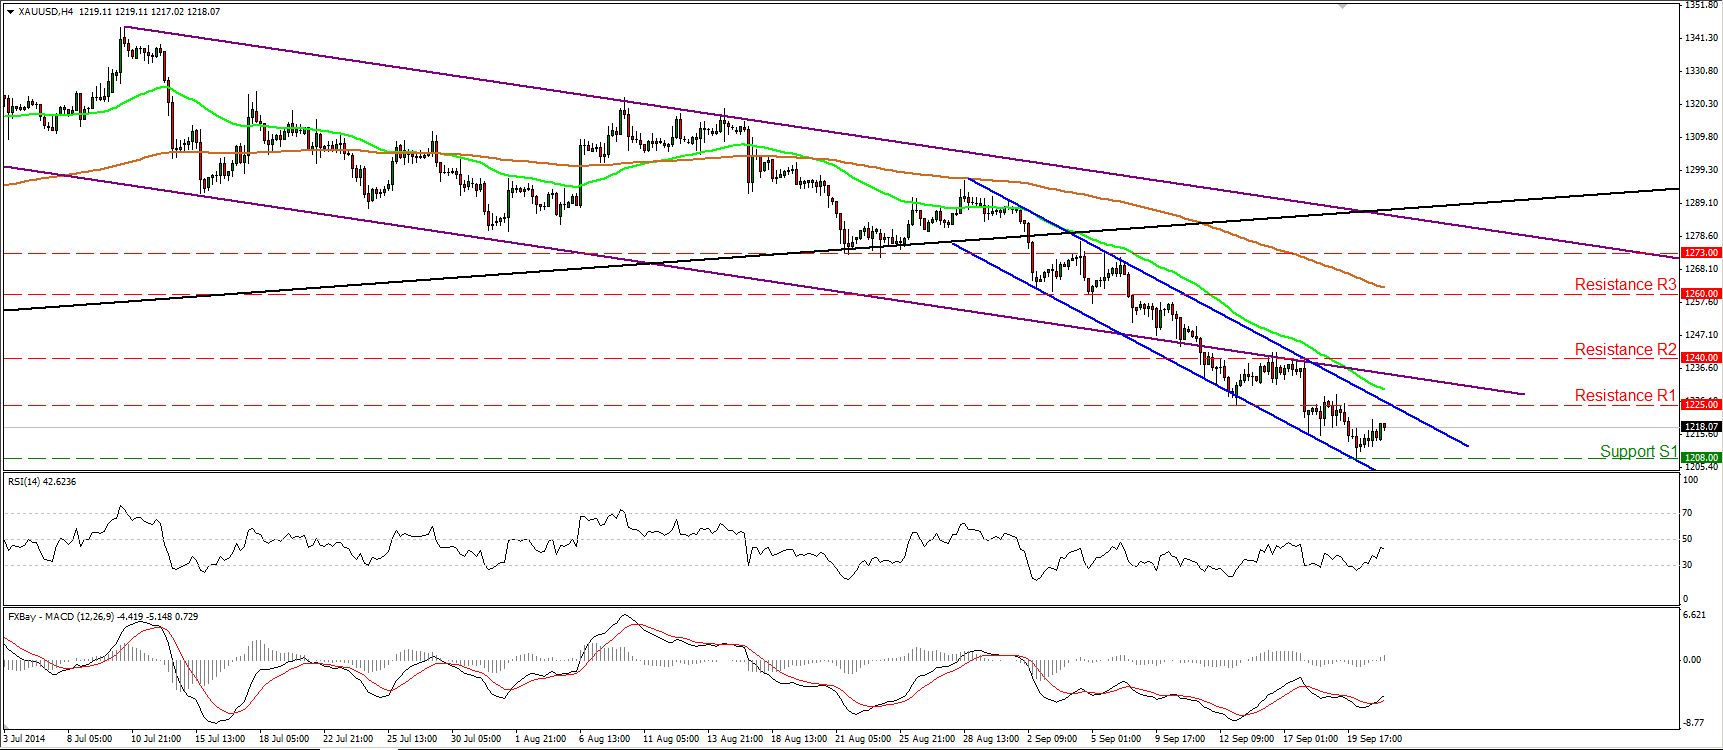
Gold rebounds from 1208
Gold moved higher after finding support at 1208 (S1), as expected. I will maintain the view that the rebound may continue, perhaps for a test near the 1225 (R1) line and the upper boundary of the blue near-term downside channel. The RSI exited its oversold field and moved higher, while the MACD, although negative moved above its signal line. Nevertheless, having in mind that the precious metal is trading within the near-term blue downside channel and below the black prior support line, drawn from back at the low of the 31st of December, I still see a downtrend and I would maintain the view that we are likely to see the metal challenging the psychological area of 1200 (S2) in the near future.
• Support: 1208 (S1), 1200 (S2), 1180 (S3).
• Resistance: 1225 (R1), 1240 (R2), 1260 (R3).
WTI keeps declining
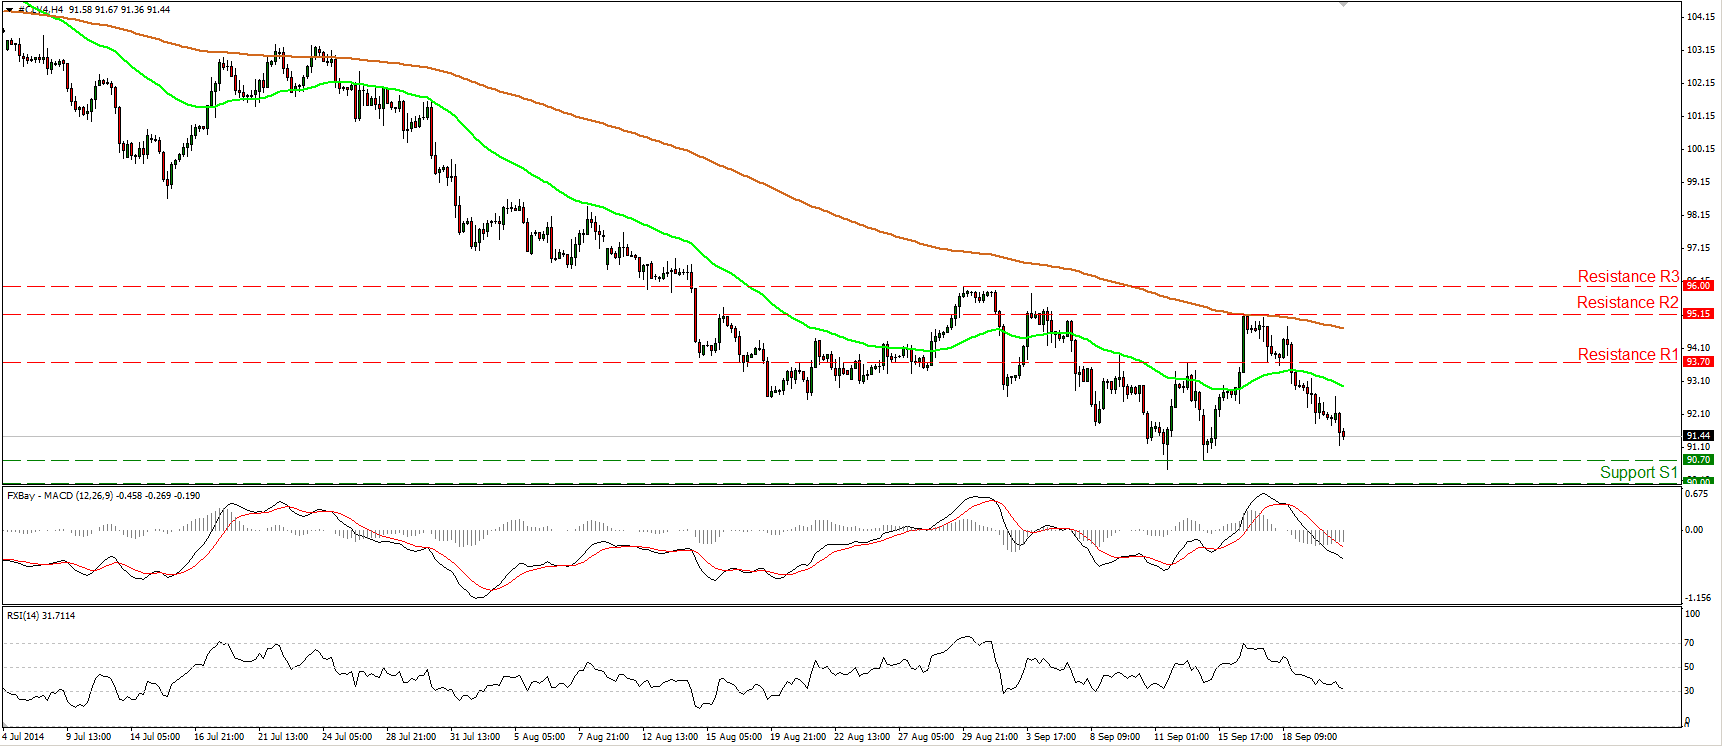
Crude continued declining on Monday and is getting closer to the 90.70 (S1) support line. The MACD moved lower after falling below zero, while the RSI declined and appears willing to fall below 30. This confirms the bearish momentum of the price action and that we are likely to see further near-term declines, at least for a test near the support line of 90.70 (S1). Zooming out on the daily chart, the trend remains to the downside in my view, but I still see positive divergence between both the daily oscillators and the price action. As a result, I would retain my “wait and see” stance as far as the overall picture of oil is concerned. I would like to see a clear dip below the psychological level of 90.00 (S2) before getting more confident about larger declines.
• Support: 90.70 (S1), 90.00 (S2), 87.65 (S3).
• Resistance: 93.70 (R1), 95.15 (R2), 96.00 (R3) .

