USD/JPY sell climax
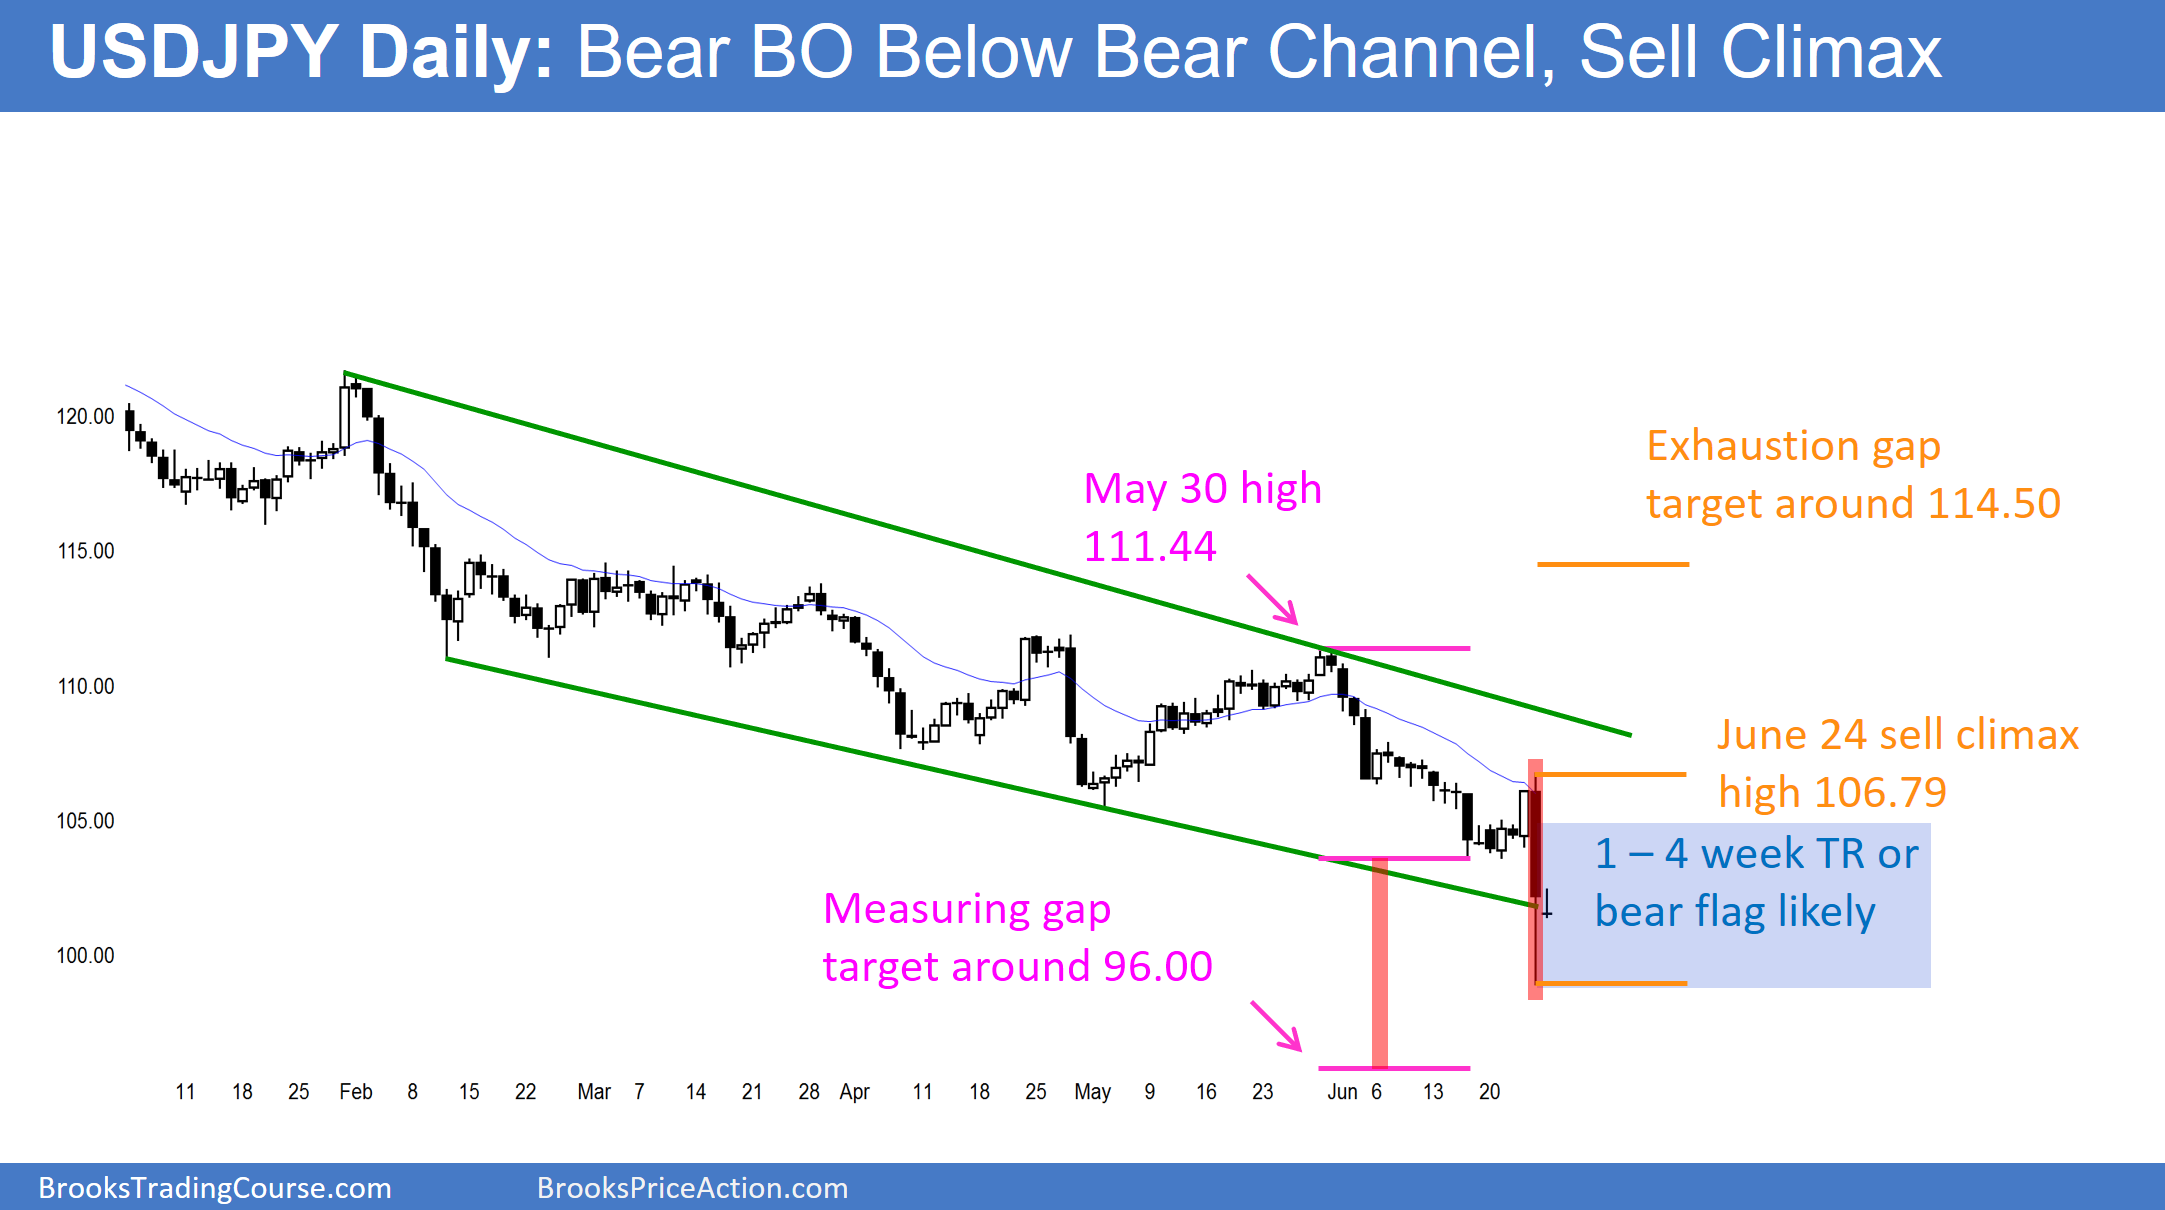
The daily USD/JPY's daily chart shows that Friday was the biggest bear trend day in the bear trend, which lasted more than 20 days.
Friday was probably an exhaustive end of the selling, but it might first reach a measure move target down around 96.00. If so, the next target is the 2012 low below 80.00.
Whether or not it does, there is a 60% chance that the gap from Friday’s close and Thursday’s low will close before the EUR/USD Forex chart falls much below that target. If it does, there would then be a 60% chance of a test above Friday’s sell climax high. If there is a strong breakout above that high, the next targets are the May lower high and a measured move up. This process will require many months to play out.
All financial markets had big trends on Friday. Yet, many remained in trading ranges, like the EUR/USD daily chart. Others had huge breakouts that will probably be the end of their trends.
The EUR/JPY formed a big bear trend bar on the daily chart. It broke far below the year long bear channel. When the biggest bear trend bar appears after a trend has gone on for 20 or more bars, it usually represents exhaustion.
This is a parabolic sell climax on the daily chart. A bear breakout below a bear channel has a 75% chance of reversing up within 5 bars. Traders must look at the highest time frame that shows the pattern. It is barely present on the weekly chart, so the reversal might take 5 weeks, not just 5 days. The target is the top of the channel, which usually then is around the top of the sell climax. That is Friday’s high. It is also usually around the moving average.
A strong bear breakout like on Friday often has a 2nd leg down. However, there is a 75% chance that the 2nd leg will form a micro double bottom with Friday’s low and lead to a rally. There is only a 25% chance that Friday’s collapse in the EUR/JPY will become a measuring gap from the June 2015 high, yet traders cannot ignore that possibility. If so, the target is the June 2015 low around 80.00. If there is a series of big bear bars closing on their lows this week, the bear will probably win.
1,000 Pip EUR/JPY Rally Starting Soon
While this is possible, the opposite is more likely. In conclusion, the yearlong bear trend in the USD/JPY is probably ending. The 1st target for the bulls is Friday’s high. Traders should wait for at least a micro double bottom, a rally to a bear flag, or a strong reversal up before buying.
When buying a sell climax with an obvious target, the stop is never clear. Since the probability is 60% or more that the EUR/JPY will reach Friday’s high over the next month or two, traders can use risk equal to the reward. They have at least a 60% chance of an 800-pip rally before an 800-pip selloff. If a trader takes this trade, he has to trade small. Once the reversal up begins, traders will be able to use higher lows for tighter stops.

