Get 40% Off
👀 👁 🧿 All eyes on Biogen, up +4,56% after posting earnings. Our AI picked it in March 2024.
Which stocks will surge next?
Unlock AI-picked Stocks

USD/JPY: Where To Find Medium Term Targets

Published 11/20/2014, 03:13 AM
Updated 07/09/2023, 06:31 AM

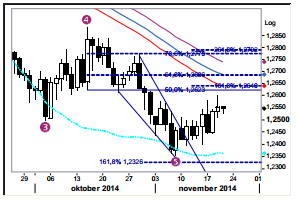
EUR/USD: Continued upward progress. The market last night, after FOMC, printed a high at 1.2602 before retreating back to the mid 1.25’s. Despite the topside failure the market continues to progress according the correction plan. Short term, with most of the orders up to 1.26 cleared, there will possible some consolidation before making the next attempt to move on to 1.2623/40 (en route either the 1.2740/90 area or if following the textbook, 1.2888).

EUR/USD Daily Chart

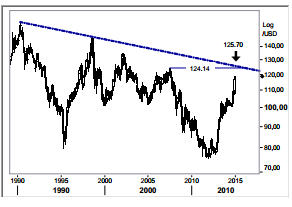
USD/JPY: Where to find medium term targets. Today we’re trying to determine some important topside reference points for this runaway phase. The next obvious target is a 161.8% Fibo projection point at 120.46. As the rise from the Oct low, 105.20, to 120.46 will be labelled wave 3 there should after a consolidation (wave 4) come a 5 th wave higher with possible targets in the 124.14-125.70 (2007 top and the top line from the early 1990’s).

USD/JPY Daily Chart

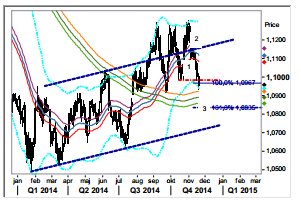
AUD/NZD: Pushing for a 1.0919 break. The bounce from the recent low point, 1.0936, only lasted for approximately 24h before the sellers gained the upper hand pushing prices lower again. Our focus is now entirely with the 1.0919 support, the confirmation point for the triple top formation and barrier to the low end of the corrective rising channel.

AUD/NZD Daily Chart

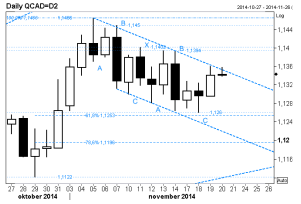
USD/CAD: Correction lower turned a corner? The overall trend points higher still and the 1.1466-1.1260 decline is a correctional to this trend. Price action over the past four sessions indicates that a correctional low is in place. Violation above the high end of the “Flag” (at market) and later advance through 1.13942 is needed to confirm. Current intraday stretches are located at 1.1285 & 1.1400.

3rd party Ad. Not an offer or recommendation by Investing.com. See disclosure here or remove ads .

USD/CAD Daily Chart

Original post

Latest comments

Risk Disclosure: Trading in financial instruments and/or cryptocurrencies involves high risks including the risk of losing some, or all, of your investment amount, and may not be suitable for all investors. Prices of cryptocurrencies are extremely volatile and may be affected by external factors such as financial, regulatory or political events. Trading on margin increases the financial risks.
Before deciding to trade in financial instrument or cryptocurrencies you should be fully informed of the risks and costs associated with trading the financial markets, carefully consider your investment objectives, level of experience, and risk appetite, and seek professional advice where needed.
Fusion Media would like to remind you that the data contained in this website is not necessarily real-time nor accurate. The data and prices on the website are not necessarily provided by any market or exchange, but may be provided by market makers, and so prices may not be accurate and may differ from the actual price at any given market, meaning prices are indicative and not appropriate for trading purposes. Fusion Media and any provider of the data contained in this website will not accept liability for any loss or damage as a result of your trading, or your reliance on the information contained within this website.
It is prohibited to use, store, reproduce, display, modify, transmit or distribute the data contained in this website without the explicit prior written permission of Fusion Media and/or the data provider. All intellectual property rights are reserved by the providers and/or the exchange providing the data contained in this website.
Fusion Media may be compensated by the advertisers that appear on the website, based on your interaction with the advertisements or advertisers.
© 2007-2024 - Fusion Media Limited. All Rights Reserved.