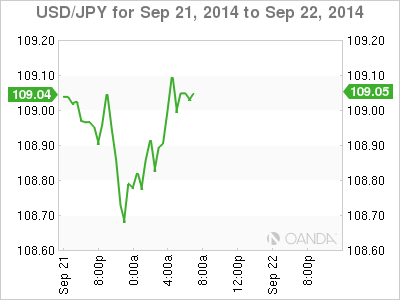
The Japanese yen continues to struggle, as USD/JPY lost about 170 points last week. The pair is trading just above the 109 line in Monday's European session, as the yen trades at its lowest level in over six years. On the release front, the only US data on the schedule is Existing Home Sales. There are no Japanese releases on Monday.
US Unemployment Claims has looked sluggish over the past two readings, but that changed on Thursday, as the key indicator sparkled, dropping to 280 thousand, down sharply from 315 thousand in the previous reading. The estimate stood at 312 thousand. Building Permits was not as strong, dipping to 1.00M. This was shy of the estimate of 1.04M.
USD/JPY gained over to 100 points on Wednesday following the Federal Reserve statement. The Fed statement reaffirmed that interest rates would remain ultra-low for a "considerable time" after the asset purchase scheme (QE) ends next month, but surprised the markets in hinting that once a rate hike was introduced, rate levels could move up more quickly than expected. As expected, the Fed trimmed QE by $10 billion/month, and the remaining $15 billion/month is scheduled to be phased out in October.
The US recovery may be deepening, but the economy continues to be affected by weak inflation levels. CPI, the primary gauge of consumer inflation, came in at -0.2%, its first drop since October. The estimate stood at +0.1%. Core CPI followed suit with a flat reading of 0.0%. This was the first time the index failed to post a gain since October 2010. The weak numbers follow disappointing manufacturing inflation data. PPI, a key event, dipped to just 0.0%, a 3-month low. The estimate stood at 0.1%. Core PPI slipped to 0.1%, down from 0.2% a month earlier. This matched the forecast. Low inflation continues to be a concern and could delay an interest rate hike in 2015.

USD/JPY September 22 at 11:30 GMT
USD/JPY 109.05 H: 109.12 L: 108.67
USD/JPY Technical
| S3 | S2 | S1 | R1 | R2 | R3 |
| 106.85 | 107.68 | 108.58 | 109.82 | 110.68 | 112.48 |
- USD/JPY edged lower in the Asian session, touching a low of 108.67. The pair then reversed directions and crossed above the 109 line in European trading.
- 108.58 is an immediate support line. 107.68 is stronger.
- 109.82 is the next resistance line.
- Current range: 108.58 to 109.82
Further levels in both directions:
- Below: 108.58, 107.68, 106.85, 105.44 and 104.17
- Above: 109.82, 110.68, 112.48, 113.68 and 114.65
OANDA's Open Positions Ratio
USD/JPY ratio is pointing to gains in long positions on Monday. This is consistent with the pair's movement, as the dollar continues to climb higher. The ratio has a majority of short positions, indicative of trader bias towards the yen reversing its sharp slide and moving to higher ground.
USD/JPY Fundamentals
- 14:00 US Existing Home Sales. Estimate 5.21M.
- 14:05 US FOMC Member William Dudley Speaks.
- 23:30 US FOMC Member Narayana Kocherlakota Speaks.
