Get 40% Off
🔥 This hedge fund gained 26.16% in the last month. Get their top stocks with our free stock ideas tool.See stock ideas

USD/JPY: Flat Dynamics Is Developing In The Pair

Published 05/29/2016, 01:06 AM
Updated 07/09/2023, 06:31 AM

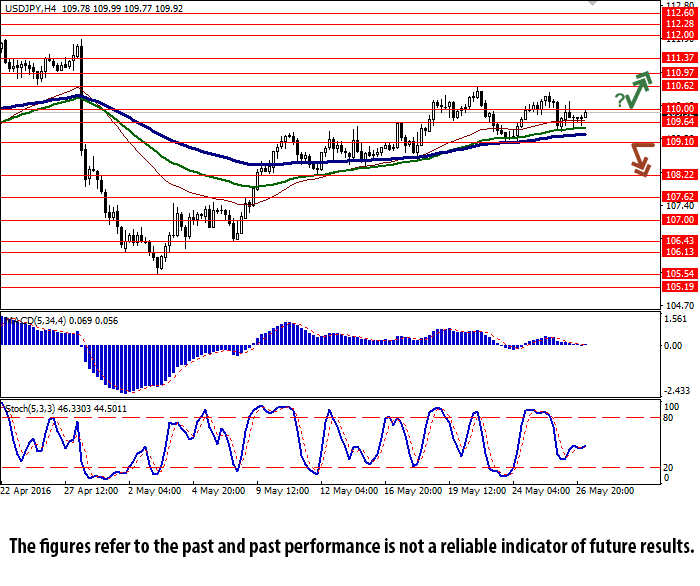
USD/JPY H4 Chart

The pair continues to show mixed dynamics trading at the level of 110.00. The USD was supported by positive American statistics, showing that the number of orders for durable goods has grown by 3.4% in April against the forecast of 0.5%. In addition, the number of initial applications for unemployment benefits fell from 278 to 268 thousand in a week which started on 20 May, against the forecast of 275 thousand. Pressure on the yen was also caused by the Japanese inflation data, released today. National index of consumer inflation fell by 0.3% in April against the decline of 0.1% a month ago.
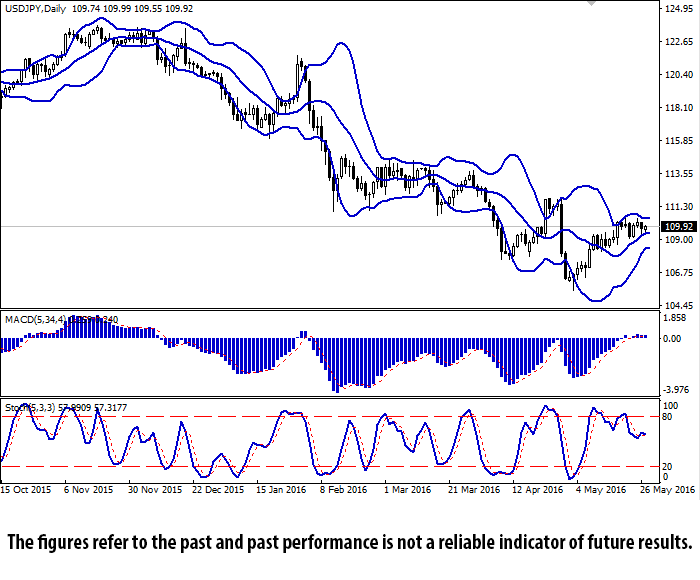
USD/JPY Daily Chart

On the daily chart “Bollinger bands®” indicator has reversed sideways, while the price range remains narrow. MACD keeps giving a weak buy signal. Stochastic shows similar dynamics.

Support levels: 109.64 (local lows), 109.10 (lows of 23 May), 108.22 (lows of 12 May), 107.62, 107.00, 106.43, 106.13, 105.54 (lows of 3 May).

Resistance levels: 110.00 (local highs), 110.62 (highs of 20 May), 110.97, 111.37, 112.00 (highs of 1 April), 112.28, 112.60 (highs of 31 March).

Latest comments

Risk Disclosure: Trading in financial instruments and/or cryptocurrencies involves high risks including the risk of losing some, or all, of your investment amount, and may not be suitable for all investors. Prices of cryptocurrencies are extremely volatile and may be affected by external factors such as financial, regulatory or political events. Trading on margin increases the financial risks.
Before deciding to trade in financial instrument or cryptocurrencies you should be fully informed of the risks and costs associated with trading the financial markets, carefully consider your investment objectives, level of experience, and risk appetite, and seek professional advice where needed.
Fusion Media would like to remind you that the data contained in this website is not necessarily real-time nor accurate. The data and prices on the website are not necessarily provided by any market or exchange, but may be provided by market makers, and so prices may not be accurate and may differ from the actual price at any given market, meaning prices are indicative and not appropriate for trading purposes. Fusion Media and any provider of the data contained in this website will not accept liability for any loss or damage as a result of your trading, or your reliance on the information contained within this website.
It is prohibited to use, store, reproduce, display, modify, transmit or distribute the data contained in this website without the explicit prior written permission of Fusion Media and/or the data provider. All intellectual property rights are reserved by the providers and/or the exchange providing the data contained in this website.
Fusion Media may be compensated by the advertisers that appear on the website, based on your interaction with the advertisements or advertisers.
© 2007-2024 - Fusion Media Limited. All Rights Reserved.