The greenback is still well-underpinned by UST yields rising which made it much more attractive versus its rival currencies.
The UST yields weighed down also the demand for gold which have been eroded recently by easing of the geopolitical concerns following US, UK and France limited attacks against the Syrian governmental infrastructures of the chemical weapons industries. These limited attacks held Russia back from taking escalating reactions.
From other side, N. Korea announcement of suspending its Nuclear bomb tests and firing of ballistic missiles raised the hopes for reaching an applicable peace deal in this region, before the meeting between Trump and Kim Jong Un which is awaited to be next month or may be in an early time of June.
The N. Korean nuclear bombs tests and firing of ballistic missiles raised the demand for safe haven several times in the recent years and raised the demand for UST weighing down on their yields, as the peace deal can take important risky factor out from the table paving the way for higher yields.
While the inflation outlook in US is ramping up amid rising of the commodities prices and the increasing of the inflation wage pressure in US.
UST 10yr yield which is now at its highest level since 2014 close by 3% weighed down on the demand for risky assets, as the investors became more worried about the outlook of placing new demand orders for equities, while the dollar became more attractive at this phase of the cycle against its rival currencies.
The US technology companies are still struggling to rebound, after last week sell-off on lower demand for semi-conductor and higher worries about the Chinese investments outlook in this sector because the Trade War tension between US and China, While the risk appetite rebounding possibility can send higher UST 10yr yield which attract the market attention.
As you can see as many ways became leading to the same UST up yield direction, USD/JPY rose to be trading now close to 108.50, after 107.90 resistance breaking out in the beginning trading hours of this new week and GBP/USD broke below 1.40 key psychological level undermined by BoE's Governor Mark Carney earlier talking at BBC about gradual path of tightening can be detained by uncertainty about Brexit outcome, while the markets are waiting ahead for UK Q1 GDP release next Friday.
God willing, the markets will be waiting by this weekend too for the release of US Q1 GDP preliminary reading which is expected to show 2% annualized growth after growth by 2.9% in the fourth quarter.
The core PCE deflator which is the Fed’s preferred gauge of inflation will be also closely watched in the beginning of next week to show the pressure on the fed to raise rates.
The core PCE Figure of February has shown yearly rising by 1.6% to be the biggest yearly rising scale since April 2017, while the Fed's yearly target is 2% and it has not been reached since the middle of 2012.
XAU/USD Daily Chart:

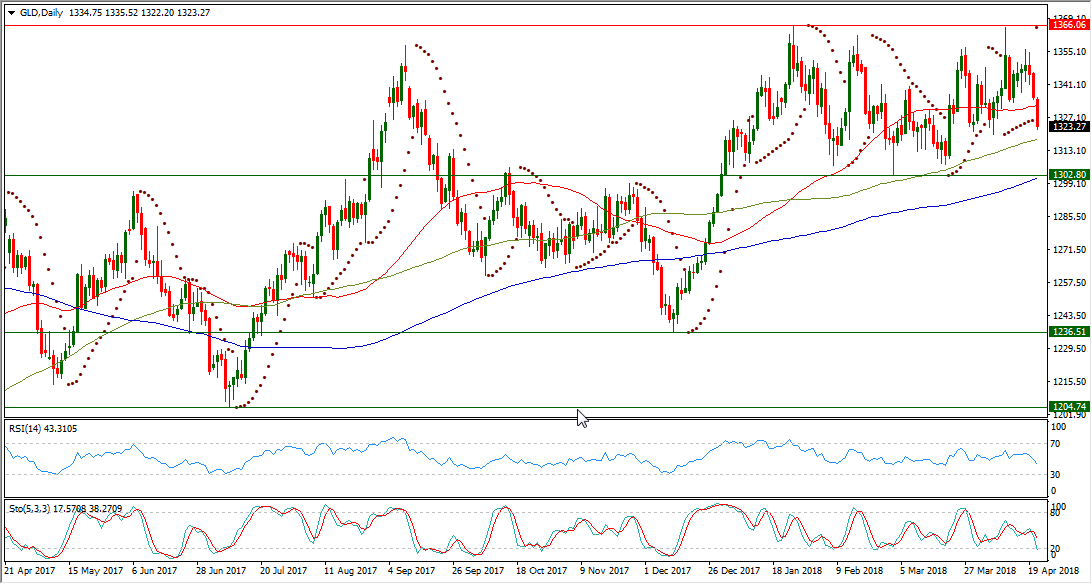
XAU/USD is living now on its first day below its daily Parabolic SAR (step 0.02, maximum 0.2) which is reading today $1365.29.
After 9 days of trading above it, XAU/USD became trading below its daily SMA50 in a closer place to its daily SMA100 which is still passing below it, while The pair is still underpinned over longer range by continued existence above its daily SMA200.
XAU/USD is still bounded by trading between $1366.06$ and $1302.80, as it could maintain existence above $1300 psychological level by forming a bottom at $1302.8 on last Mar. 1, after retreating from last Jan. 25 high at $1366.06.
XAU/USD today slide put its RSI-14 in a lower place inside its neutral area reading 43.310.
While XAU/USD daily Stochastic Oscillator (5, 3, 3) which is more sensitive to the volatility is having now its main line actually inside its oversold territory below 20 reading 17.570 and leading to the downside its signal line which is still inside the neutral territory at 38.270.
Important levels: Daily SMA50 @ $1332, Daily SMA100 @ $1318 and Daily SMA200 @ $1301
The nearest S&R:
S1: $1302.80
S2: $1236.51
S3: $1204.74
R1: $1366.06
R2: $1375.20
R3: $1392.09
