US news was very positive this week. The second estimate for 3rd quarter GDP increased .3% to 3.2%. Personal incomes and spending continued to rise as well. Durable goods, which have been weak due to the oil market collapse, increased for the second consecutive month. And the employment report showed solid gains. The markets sold off a bit with defensive sectors rising. But considering the strong post-election rally, this sell-off is hardly unexpected.
On Tuesday, the BEA released their second estimate of 3rd quarter GDP, which increased from 2.9% to 3.2%. PCEs rose 2.8% with durable goods purchases increasing a healthy 11.6%. Investment rose 2.1% largely due to a very positive 10.1% increase in non-residential structures. Finally, goods exports rose a surprisingly high 10.1%. Overall, this was a very solid report and one that points to a strengthening in the underlying economy.
Real disposable personal income increased .4% while real PCEs were up .1%. Durable goods spending continued to impress, rising 1%, while non-durable goods spending increased .8%. Oddly, service spending decreased .3%. The longer term trends for the PCE subcategories are very positive.
The continued increase in durable goods purchases continues to be the big story of this expansion. This category of spending (above in blue) has increased consistently since 2010. Better still, non-durable goods orders (above in red) – which had been moving sideways for most of 2015, are now in a solid uptrend. Service spending is almost always increasing.
The ISM’s manufacturing index rose 1.3% to 53.2; new orders and production increased while 11/18 industries expanded. Best of all, the report’s anecdotal comments were consistently strong:
- "Raw materials have been rather flat. Ramping up for year-end and reducing inventory is main supply chain goal at this time." (Chemical Products)
- "Strong manufacturing numbers in anticipation of strong year-end bookings." (Computer & Electronic Products)
- "Business is still steady. We are foregoing our shutdown over Christmas break due to an increase in customer orders." (Plastics & Rubber Products)
- "Heading into 2017, our business levels look pretty consistent compared to 2016." (Primary Metals)
- "Sector remains strong, orders and forecasts are consistent and demand outlook is positive." (Food, Beverage & Tobacco Products)
- "New spec buildings going up in our area. Local companies adding additional production space which equates to higher employment." (Machinery)
- "Business conditions are good. Labor market is tightening such that it is difficult to staff to completely fulfill production demand." (Miscellaneous Manufacturing)
- "We are seeing an upswing in customer Requests for Quotations this month; this is a positive sign for our business." (Textile Mills)
- "Continued strong seasonal demand for product." (Nonmetallic Mineral Products)
- "2017 is looking to be a very busy year." (Fabricated Metal Products)
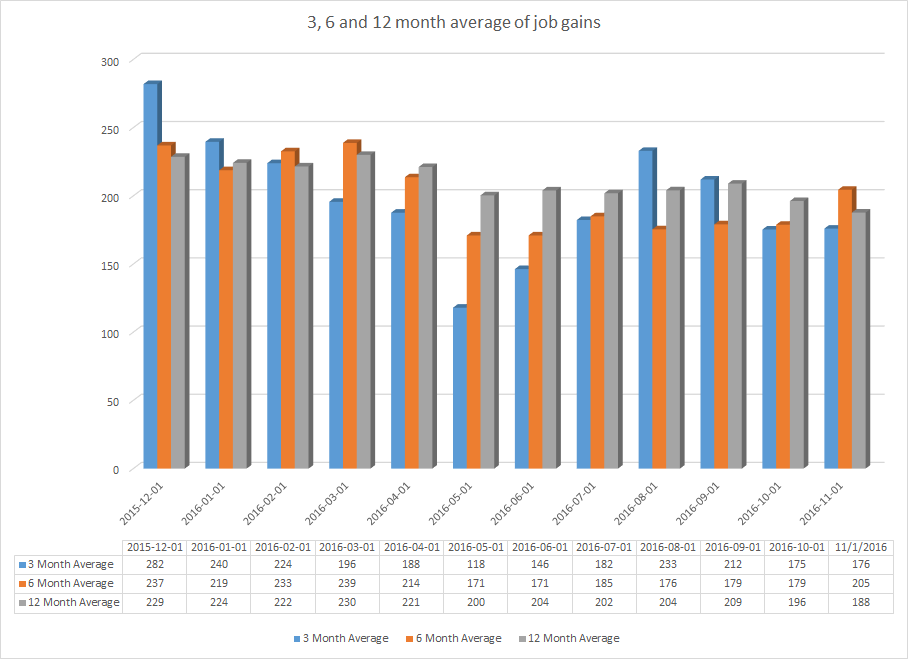
Finally, Friday’s job report had a headline number of 178,000 of gains. As the following graph shows, the 3, 6 and 12 month averages are all between 150,000 and 200,000:

These averages are adequate with the unemployment rate now at 4.6%.
Economic Conclusion: this week’s news was very positive. The economy is growing strongly and consumers are still spending, especially on big-ticket items. The manufacturing sector is steady and the labor market is adding jobs at an appropriate level for a 4.6% unemployment rate.
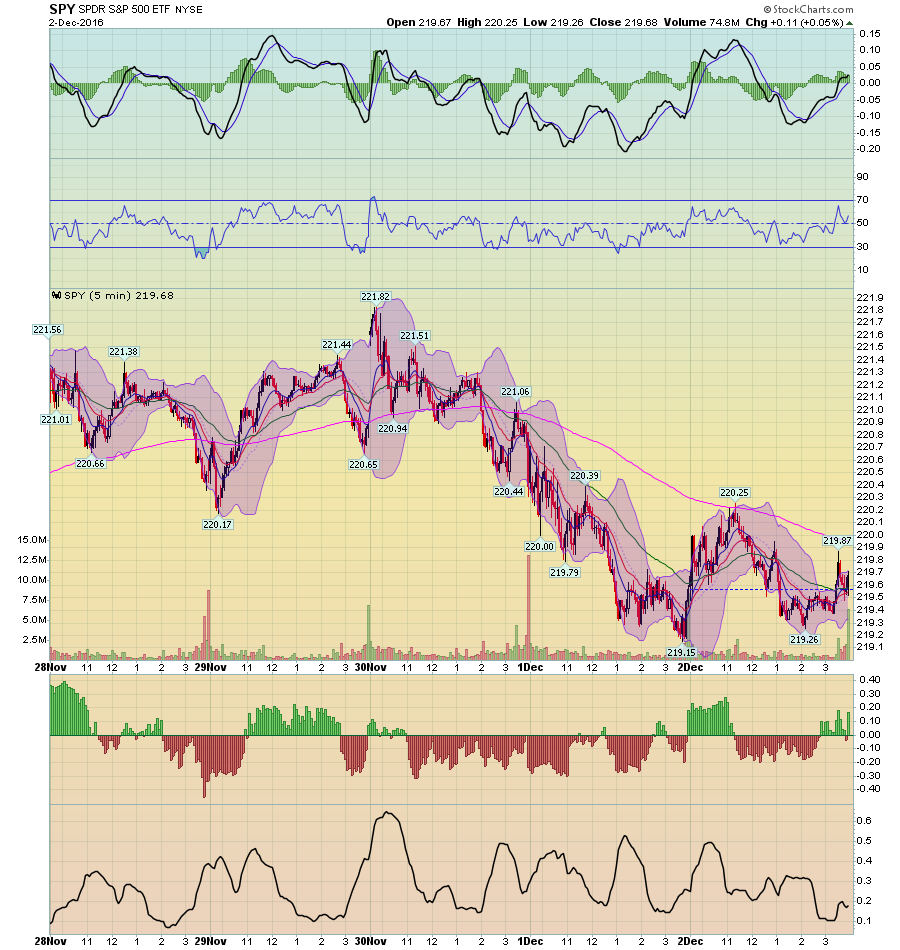
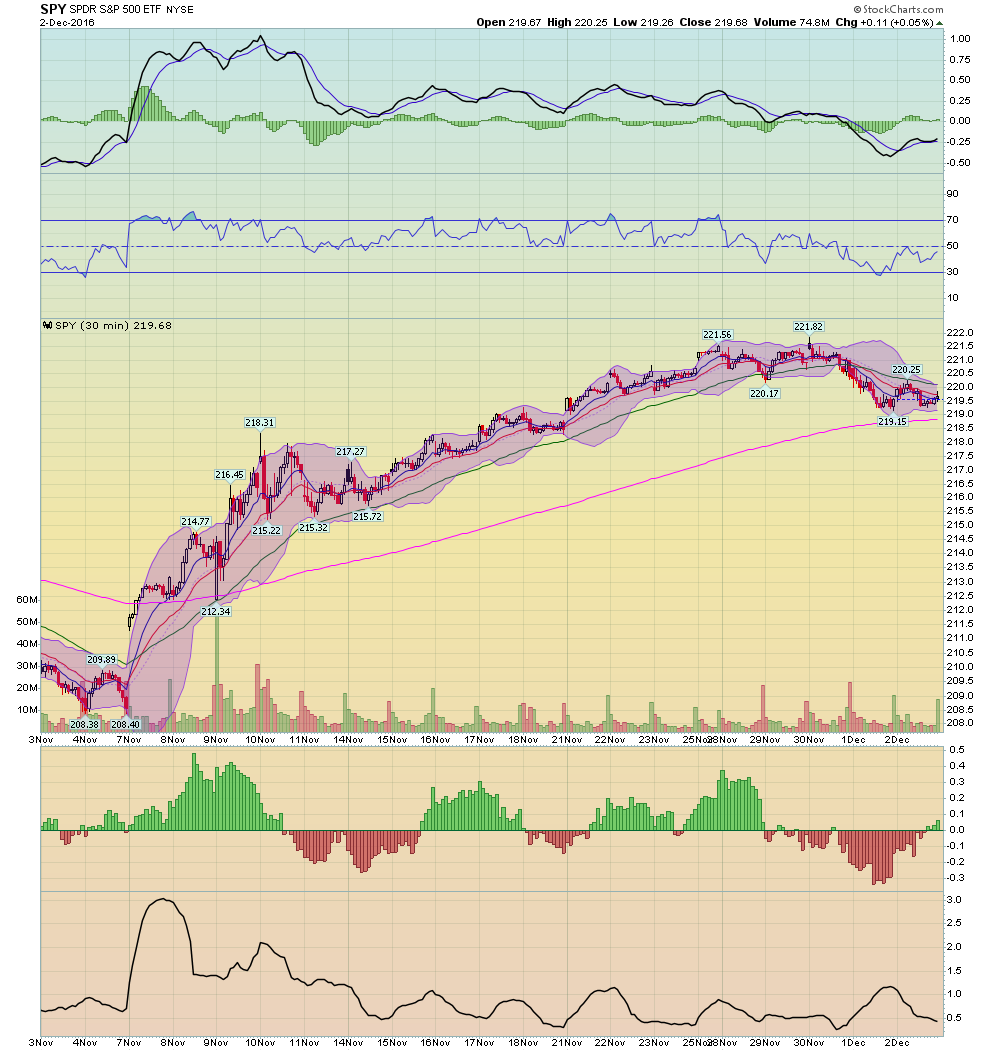
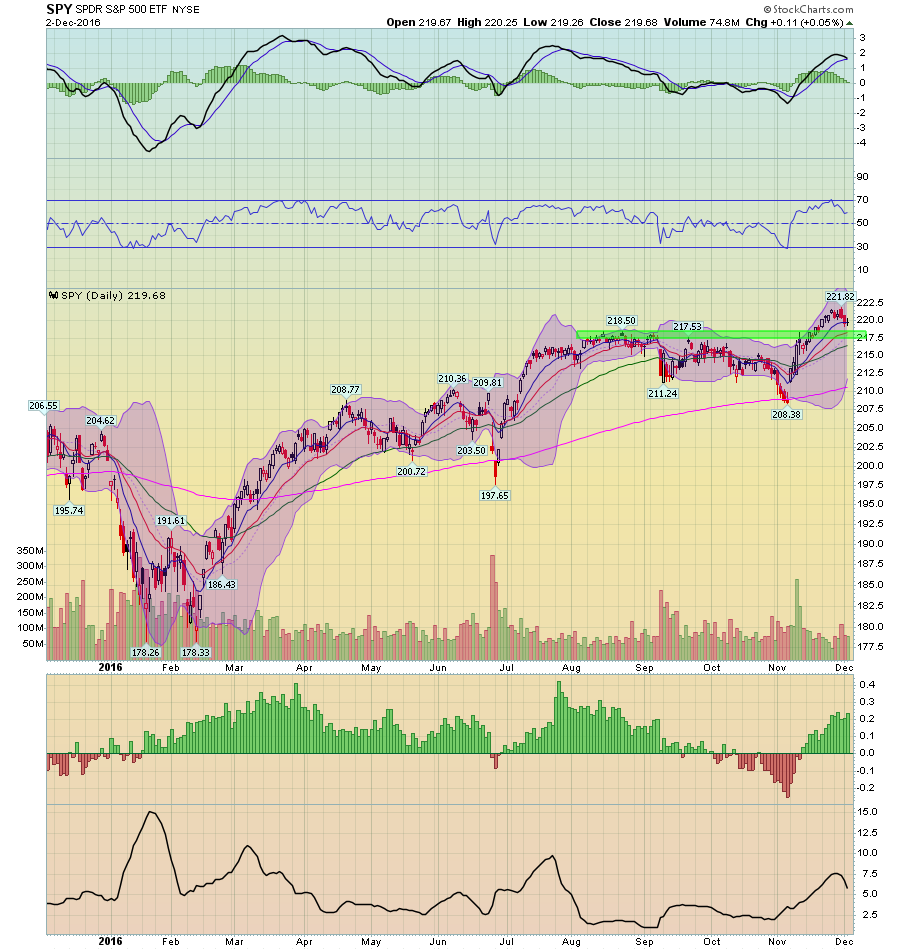
Market Overview: last week, defensive sectors were the primary movers, with the utilities up nearly 1% and the staples advancing .64%. The averages sold off a bit from their post-election reflation trade (via SPDR S&P 500 (NYSE:SPY)):


The primary downward movement occurred between Wednesday AM and Thursday PM (top chart; daily 5-minute). But placing this sell-off into a broader context, it looks more like a standard sell-off that blows off trading excess (middle chart, 30-day, 15-minute intervals). Finally, the daily chart (bottom chart; daily bars) shows that prices are now targeting the 217-218 price area, which is now providing technical support.
So, where does this leave us? There are only three weeks left in the trading year, and two of those are half weeks because of the Christmas and New Year’s Eve holidays. Barring a jarring economic event, don’t expect much to happen.
