
The US dollar traded higher against all the other major currencies yesterday and today in Asia. Still, equities generally gained, perhaps due to bargain hunters entering at low levels ahead of the US CPIs for April due out later in the day.
The forecasts point to slowdowns, but even if that’s the case, the Fed is expected to continue hiking fast in the months to come. As for tonight, the focus will turn to the BoJ Summary of Opinions, while during the early European tomorrow, the highlight may be the UK GDP for Q1.
Equities Gain Ahead of US Inflation Data
The US dollar outperformed all the other major currencies on Tuesday and during the Asian session Wednesday, with the main losers being NZD, CHF, EUR, and GBP, in that order. The currencies against which the greenback eked out the least gains were CAD, AUD, and JPY.

The strengthening of the US dollar, combined with the relative strength of the Japanese yen and the weakening of the risk-linked Kiwi, points to risk-off trading activity. However, the slide in the Swiss franc and the relative strength of the Aussie and the Loonie point otherwise. Thus, with the FX market painting a very blurry picture regarding the broader market sentiment, we prefer to turn our gaze to the equity world.
There, we see that all but one of the major EU indices under our radar have traded in the green, with the only one failing to record any gains being Spain’s IBEX 35. In the US, NASDAQ gained the most, and the S&P 500 also finished positive, but the Dow Jones Industrial Average lost some ground. Today in Asia, market sentiment remained supported.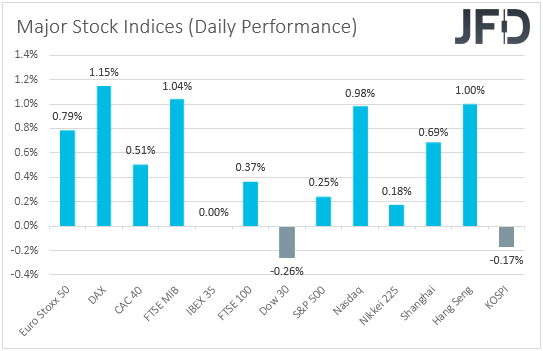
With no clear catalyst behind the boost in investors’ morale – at least we couldn’t find any fundamental reason for that – we believe that bargain hunters returned to buying beaten-down stocks before the US CPIs for April later in the day. Both the headline and core CPIs are forecast to have slowed to +8.1% YoY and +6.0% YoY, from 8.5% and 6.5%, respectively.
At its latest meeting, the FOMC decided to lift interest rates by 50bps as was widely anticipated, but Fed Chair Jerome Powell downplayed the chances for a 75bps hike in June, saying that 50bps hikes should be on the table at the next couple of meetings.
This resulted in a slide in the US dollar, but that was a one-day story, with the greenback making a comeback as market participants re-evaluated the situation and brought back to the table their triple-hike bets. However, the latest remarks by Atlanta Fed President Raphael Bostic that they are unlikely to use anything bigger than 50bps hikes prompted participants to remove their triple-hike bets again.
According to the CME FedWatch tool, there is only a 10% chance for a 75bps hike, while the rest 90% is assigned to another 50bps. So, a potential slowdown in the CPIs could add credence to the view that only 50bps increments will be delivered in the months to come and may result in a setback in the US dollar.
However, we stick to our guns that even with that, the Fed remains among, if not the most hawkish major central bank, and thus, we would expect the US dollar to rebound soon and continue its latest uptrend, especially against currencies the central banks of which are expected to follow a much slower and smoother tightening path.
Suppose the CPI numbers come higher than expected. In that case, the greenback is likely to shoot instantly higher, as better numbers could revive speculation that a triple hike may be needed at one of the upcoming Fed gatherings.
BoJ Summary of Opinions and UK GDP in Focus Early Tomorrow
Now, tonight, during the Asian session Thursday, the attention will likely be transferred to the Summary of Opinions from the latest BoJ gathering. At that gathering, the BoJ kept all its policy settings untouched, noting that it would offer to buy unlimited amounts of 10-year government bonds to defend an implicit 0.25% cap around its zero target every market day.
This put at rest rumors that the Bank may need to tweak its yield curve control policy soon due to the continued tests near that cap and the yen's weakness and reaffirmed the strong willingness of policymakers to stay ultra-loose at a time when other major central banks have flagged aggressive tightening.
A strong reminder of that in the Summary of Opinions could result in another round of selling in Japanese yen. However, with concerns over global growth intensifying lately, we believe that the safer pair to exploit any further yen weakness may be USD/JPY. Let’s not forget that the Japanese yen is also a haven where investors seek shelter during turbulence and uncertainty.
During the early EU session Thursday, the spotlight is likely to turn to the first estimate of the UK GDP for Q1. Alongside that figure, we get the business investment numbers for the quarter, the industrial and manufacturing production rates for March, as well as the trade balance for the month.

Economic activity is forecast to have slowed to +1.0% QoQ from +1.3%, but this would take the YoY rate up to +9.0% from +6.6%. There is no forecast for the business investment. While industrial production is forecast to have rebounded fractionally, manufacturing production is expected to have slid again, at a somewhat faster pace than in February.
Remember that the BoE hiked by 25bps as was widely anticipated last week but warned over recession risks, projecting a contraction for next year. Thus, a 1.0% growth rate and a higher YoY one could ease concerns over a UK recession.
However, bearing in mind that we are already well into the second quarter and that the Bank’s projections were for next year, we believe that market participants will remain cautious concerning the BoE’s future course of action. Due to high inflation, the Bank is likely to continue lifting interest rates, but the recession concerns could slow down the process, keeping the British pound under selling interest.
GBP/USD – Technical Outlook
GBP/USD has been trading sideways since May 5, between the 1.2250 territory and the 1.2410 level. However, in the bigger picture, the pair remains in a downtrend, and this is confirmed by the fact that it is still trading below all three of our moving averages on the 4-hour chart, which are pointing down. Thus, we believe that there are more chances for the bear to exit its recent very short-term range to the downside.
A clear and decisive dip below 1.2250 would confirm a forthcoming lower low and may pave the way towards the 1.2080 barrier, which is marked by the low of May 18. If the bears are unwilling to stop there, then a break lower could see scope for larger declines, perhaps towards the low of March 26, at 1.1780.
We would start examining a bullish short-term reversal upon a break above 1.2635, a resistance defined by the high of May 4. This may initially allow advances towards the 1.2775 level, marked by the high of April 26, the break of which could set the stage for a test at 1.2975, a level which acted as decent support between Apr. 8 and 19.
If the bulls do not stop there either, then we may see them pushing towards the 1.3150 area, marked by the high of April 14.

USD/JPY – Technical Outlook
USD/JPY traded fractionally higher yesterday, and then it continued in a consolidative manner until today in Asia. The rate remains above the upside support line drawn from the low of Mar. 31, keeping the outlook cautiously positive. However, we prefer to wait for a break above 131.35 before we get confident about a trend continuation, as the pair has failed twice recently to overcome that zone.
So, a clear break above 131.35 would confirm a forthcoming higher high and take the rate into territories last tested in 2002, with the next resistance identified at 133.80, marked by the high of March of that year. Another break, above 133.80, could carry extensions towards the 135.15 zone, which stopped the rate from moving higher between January and February 2002.
On the downside, we would like to see a decisive dip below 128.60 before we start examining a bearish trend reversal. Such a move would confirm the break below the aforementioned upside line and the completion of a double top formation as well.
The bears could then target the low of Apr. 26, at 126.90, the break of which could carry extensions towards the low of Apr. 14, at 125.05. If they don’t stop there, we may see them pushing towards the 123.45 barrier, marked by the low of Apr. 7.
