For the bond market, the release of the Fed minutes was this week’s biggest news. The Fed described employment positively. They also noted personal consumption expenditures and capital expenditures were “solid.” Housing was mixed, but continued to show a general, slow recovery. Industrial production was weak, but largely due to the strong dollar and weak international environment. As for inflation, they noted that overall CPI was weak, but expected it to rise with oil and import prices over the next 12-18 months. As for rates, the Fed felt the next hike would be in December:
Members emphasized that this change was intended to convey the sense that, while no decision had been made, it may well become appropriate to initiate the normalization process at the next meeting, provided that unanticipated shocks do not adversely affect the economic outlook and that incoming data support the expectation that labor market conditions will continue to improve and that inflation will return to the Committee's 2 percent objective over the medium term.
The BLS reported CPI this week. Total CPI increased .2% Y/Y while core rose 1.9%. The following FRED chart shows that core prices are close to the Fed’s stated 2% level, while total CPI remains near 0%:
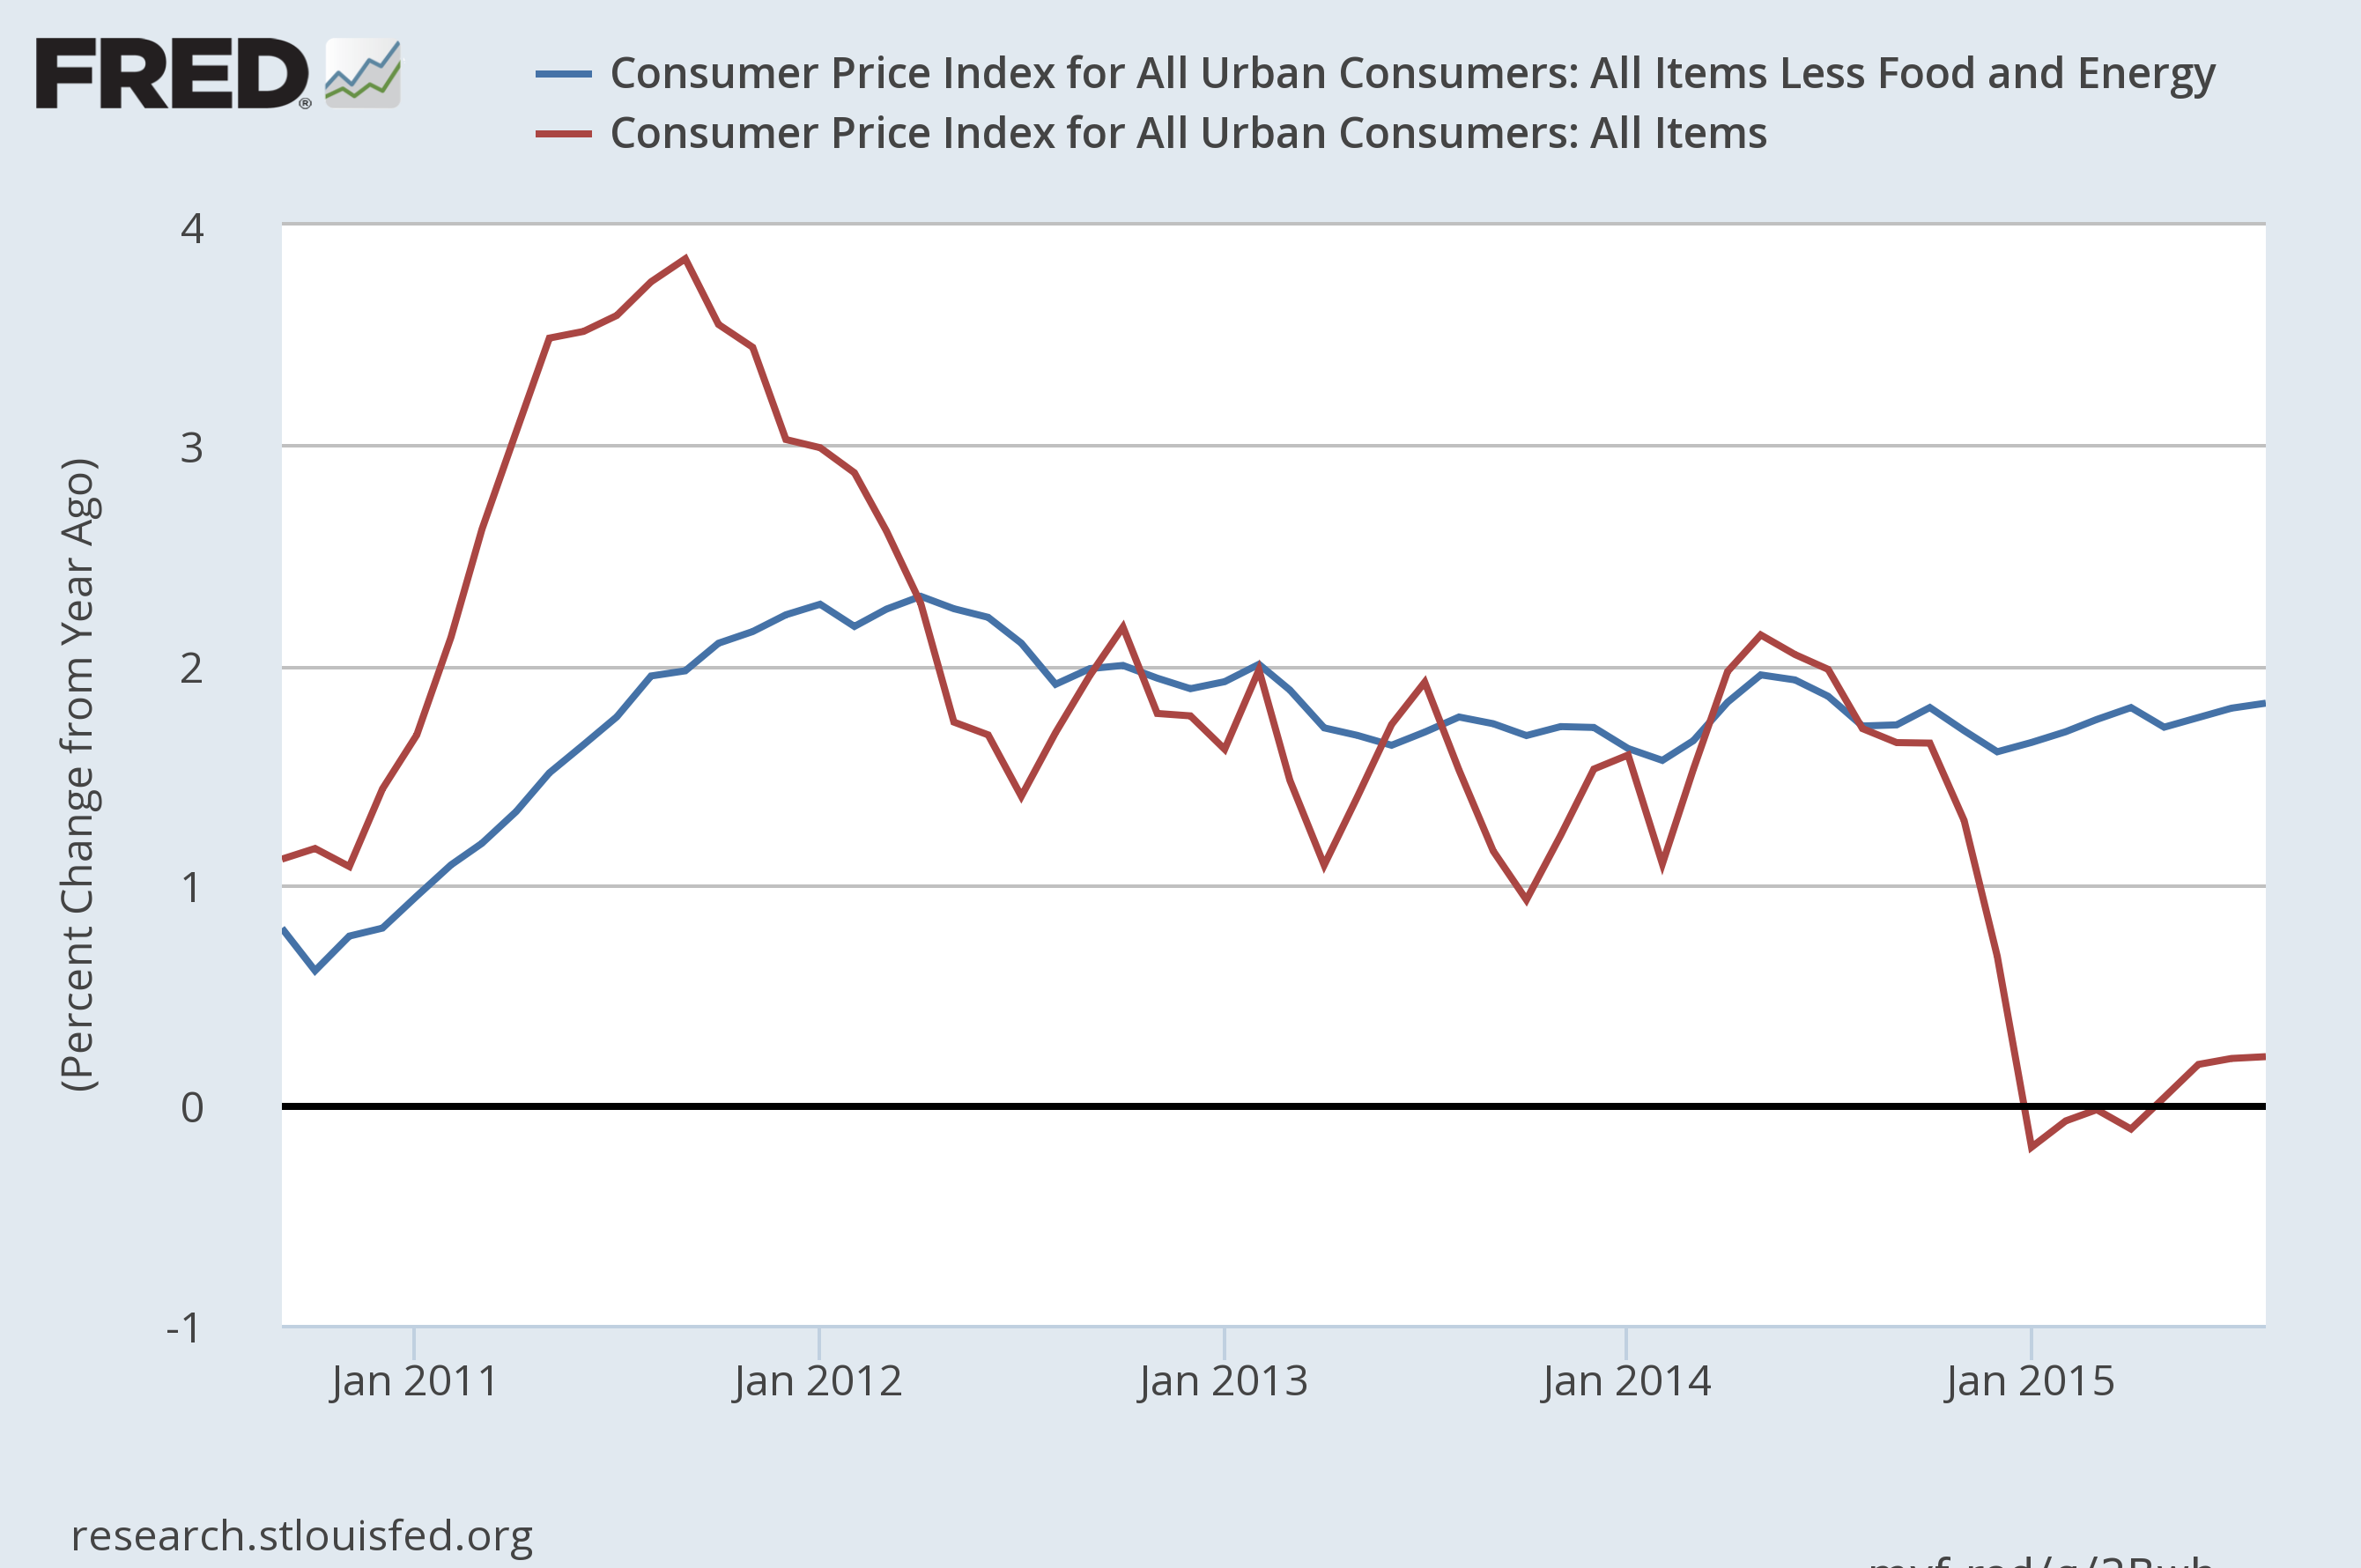
Fed hawks recently argued that weak oil prices were the primary reason for the weak total CPI reading. Scott Grannis makes the same observation:
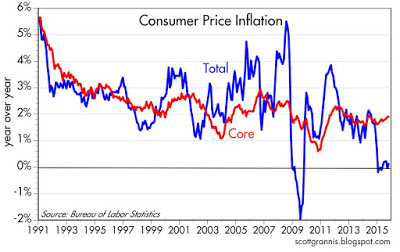
The year over year change in the CPI has been roughly zero for the past 10 months, but that's purely a function of sharply lower oil prices. Ex-energy, consumer price inflation has been running about 2% per year on average for the past 13 years. What's notable is not the low level of headline inflation, it's the continued existence of 2% core inflation despite the fact that economic growth has been unusually sluggish for a number of years.
He offers the following chart:
The Fed believes oil prices will quickly rebound. But prices are weak across the entire commodity complex. For example, copper and zinc traded at a six-year lows last week. Copper companies, feeling the pinch of bond payments, continue to supply the market rather than shut down production. The Chinese steel market is massively over-supplied. And the agricultural commodity complex currently trades near five-year lows:
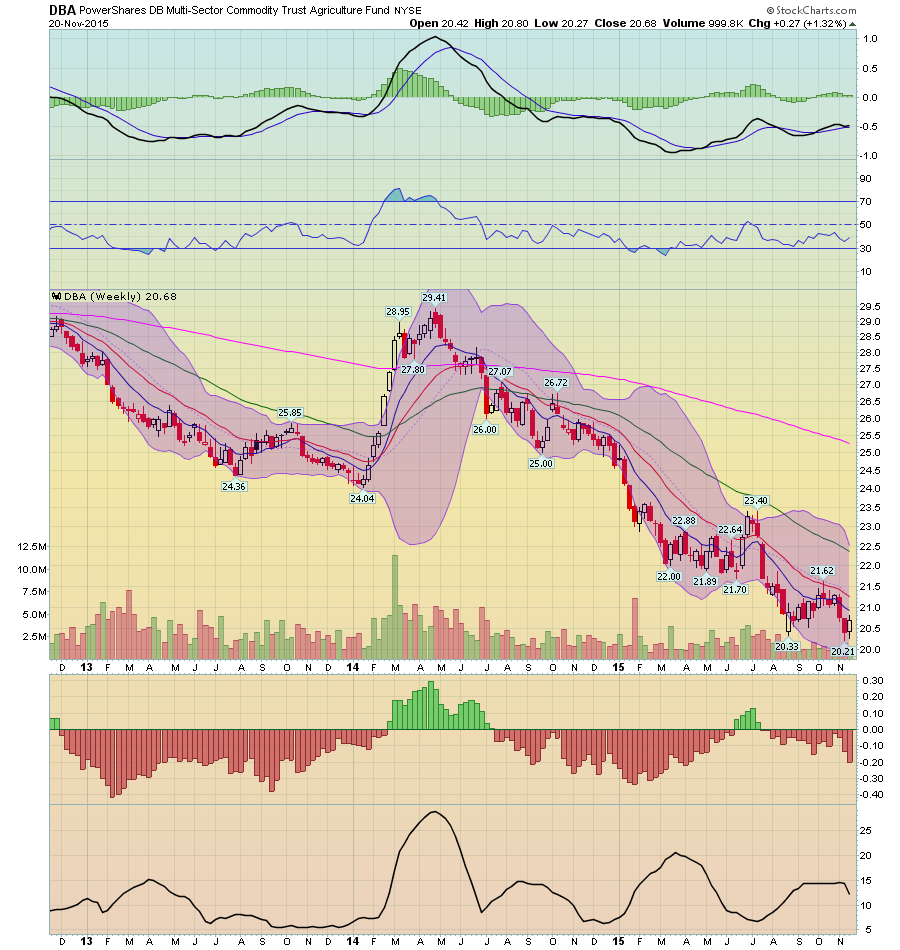
As a result, consumers now think that prices will be below the Fed’s 2% target for the next decade:
The Federal Reserve Bank of Cleveland reports that its latest estimate of 10-year expected inflation is 1.80 percent. In other words, the public currently expects the inflation rate to be less than 2 percent on average over the next decade.
The Cleveland Fed’s estimate of inflation expectations is based on a model that combines information from a number of sources to address the shortcomings of other, commonly used measures, such as the “break-even” rate derived from Treasury inflation protected securities (TIPS) or survey-based estimates. The Cleveland Fed model can produce estimates for many time horizons, and it isolates not only inflation expectations, but several other interesting variables, such as the real interest rate and the inflation risk premium. For more details, see the links in the box at right.
The data indicates a quick price rebound is a lower and lower possibility.
As for the bond market, we’re seeing a very interesting development. US Treasuries are widening over their peers:
The extra yield Treasury two-year notes offer over their Group-of-Seven peers widened to the most since 2007 as the Federal Reserve considers raising interest rates as soon as next month.
The spread reached about 77 basis points before the Fed’s release on Wednesday of minutes from its Oct. 27-28 meeting. Policy makers said after that session that they’ll consider raising the overnight target rate at their Dec. 15-16 gathering. By contrast, the European Central Bank is considering adding monetary stimulus.
But the entire yield curve is selling off, so the overall spread remains nearly un-moved:
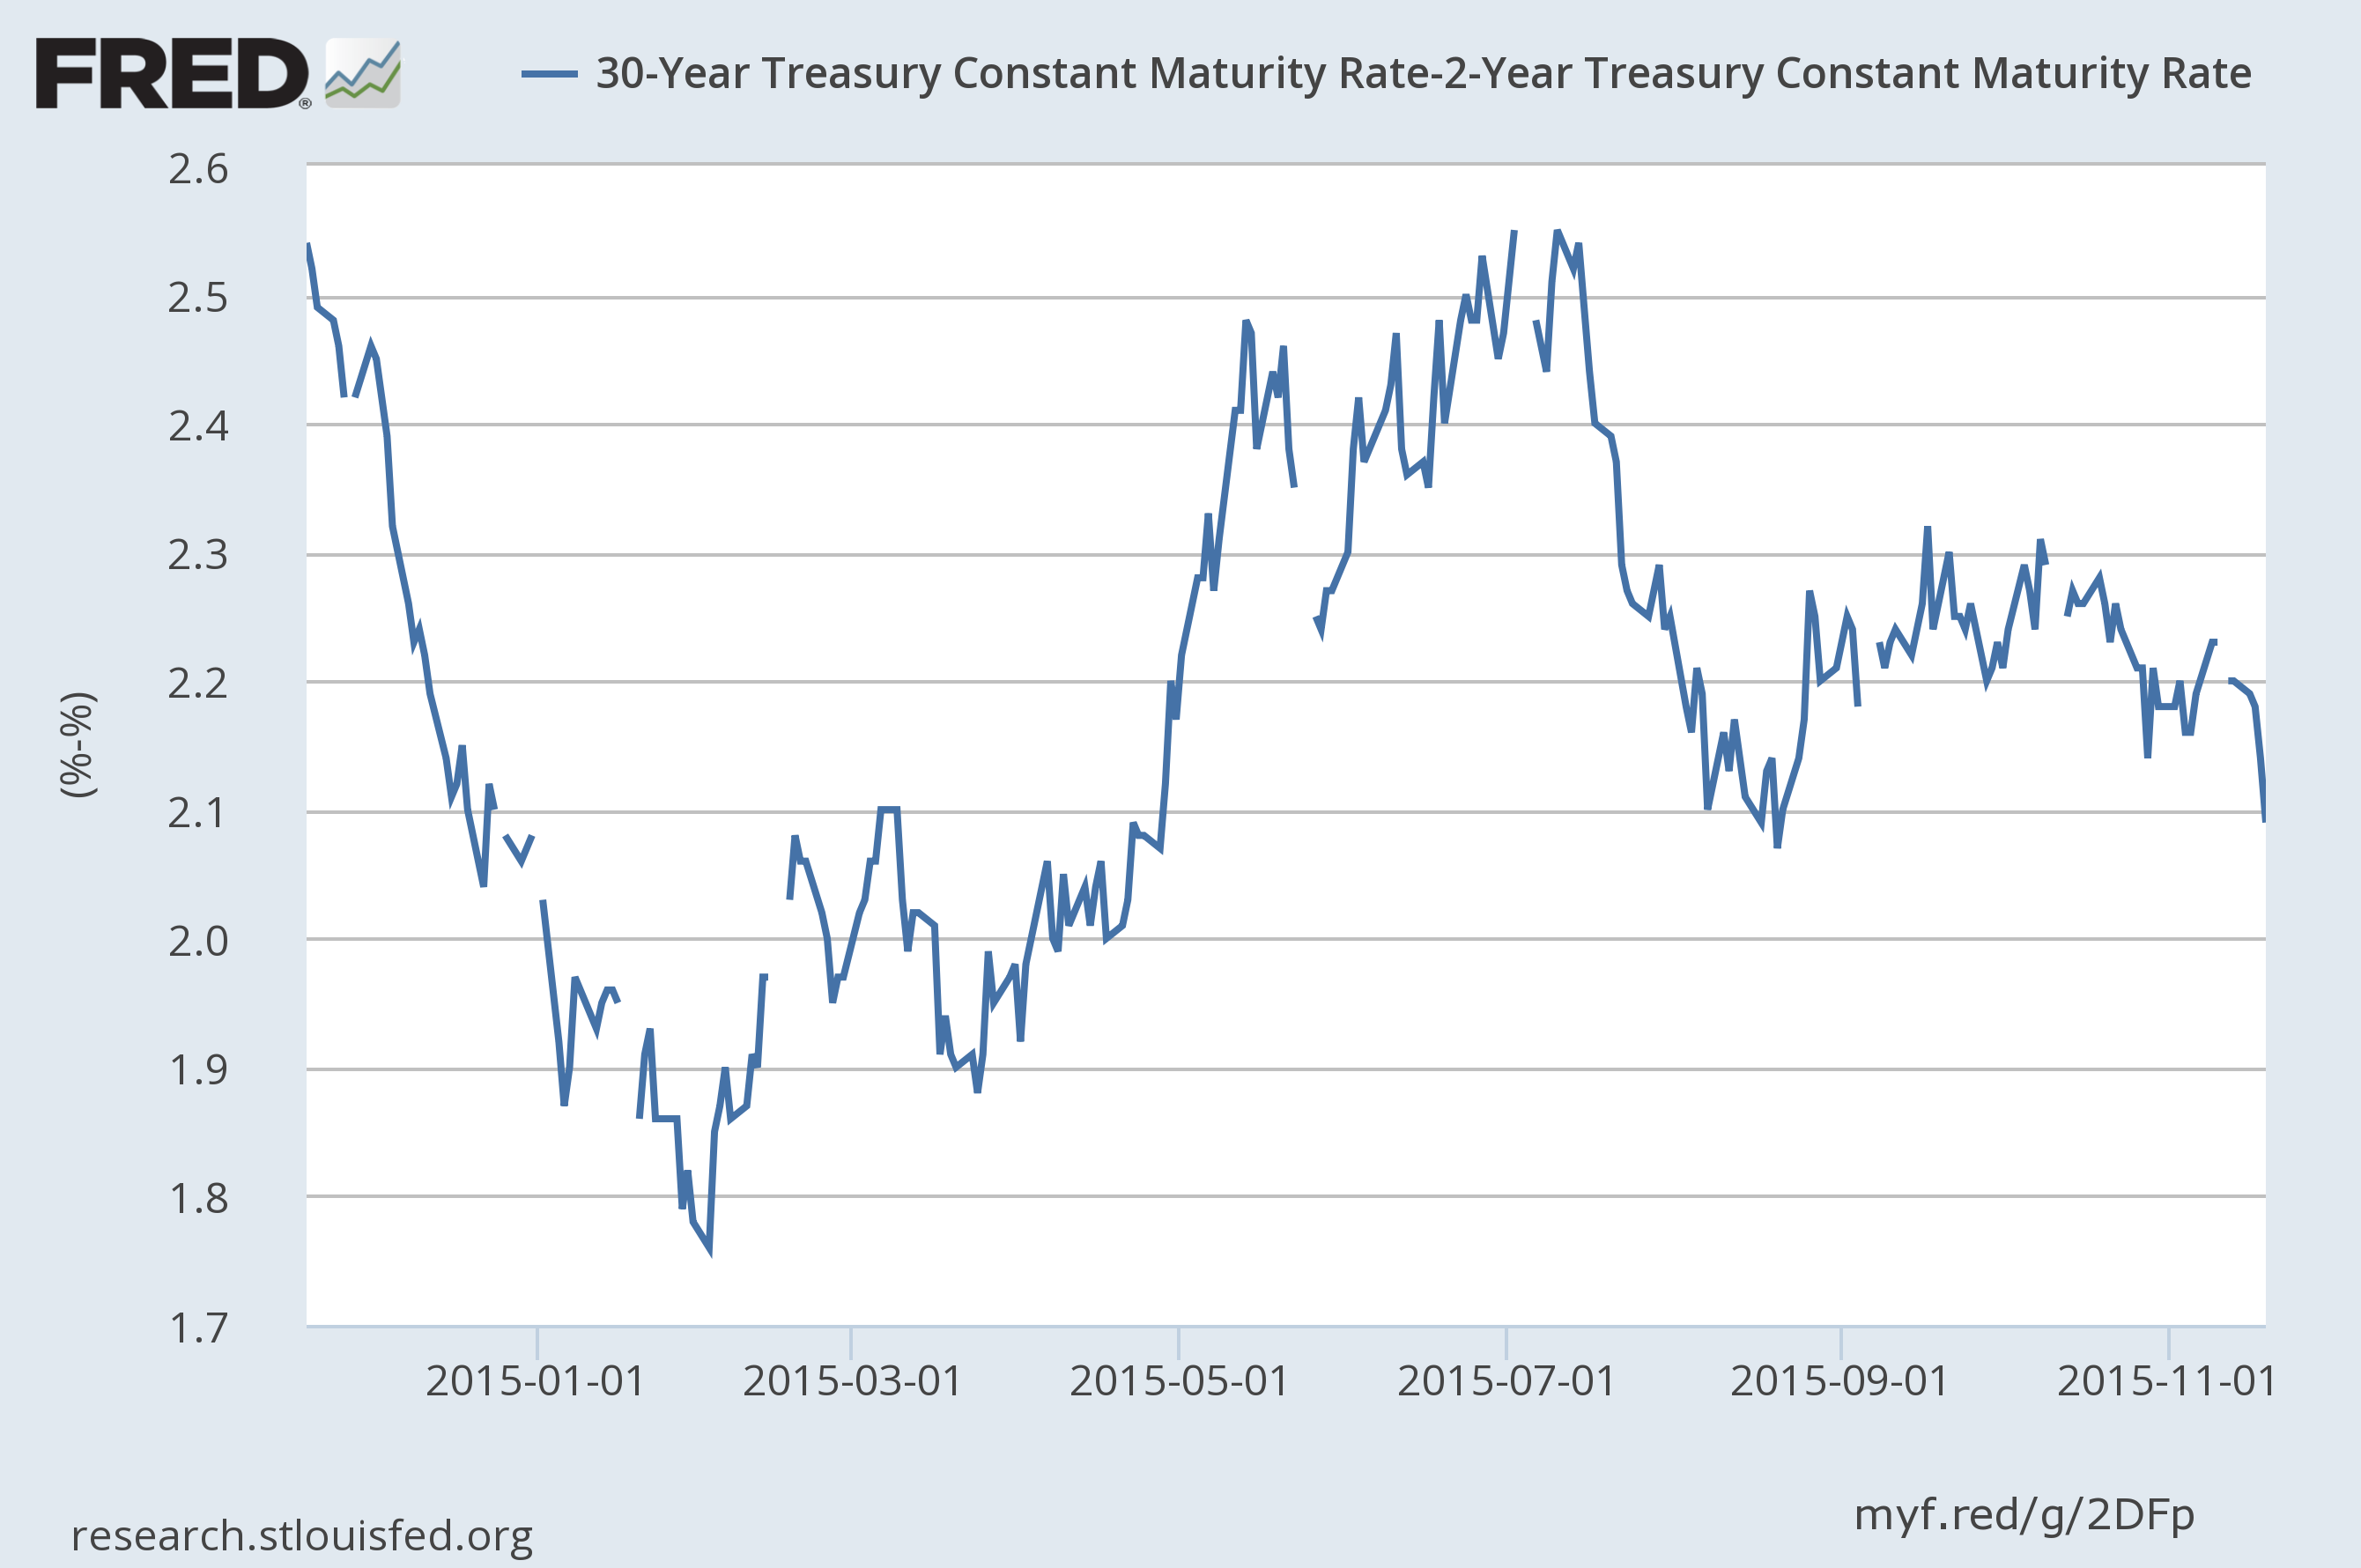
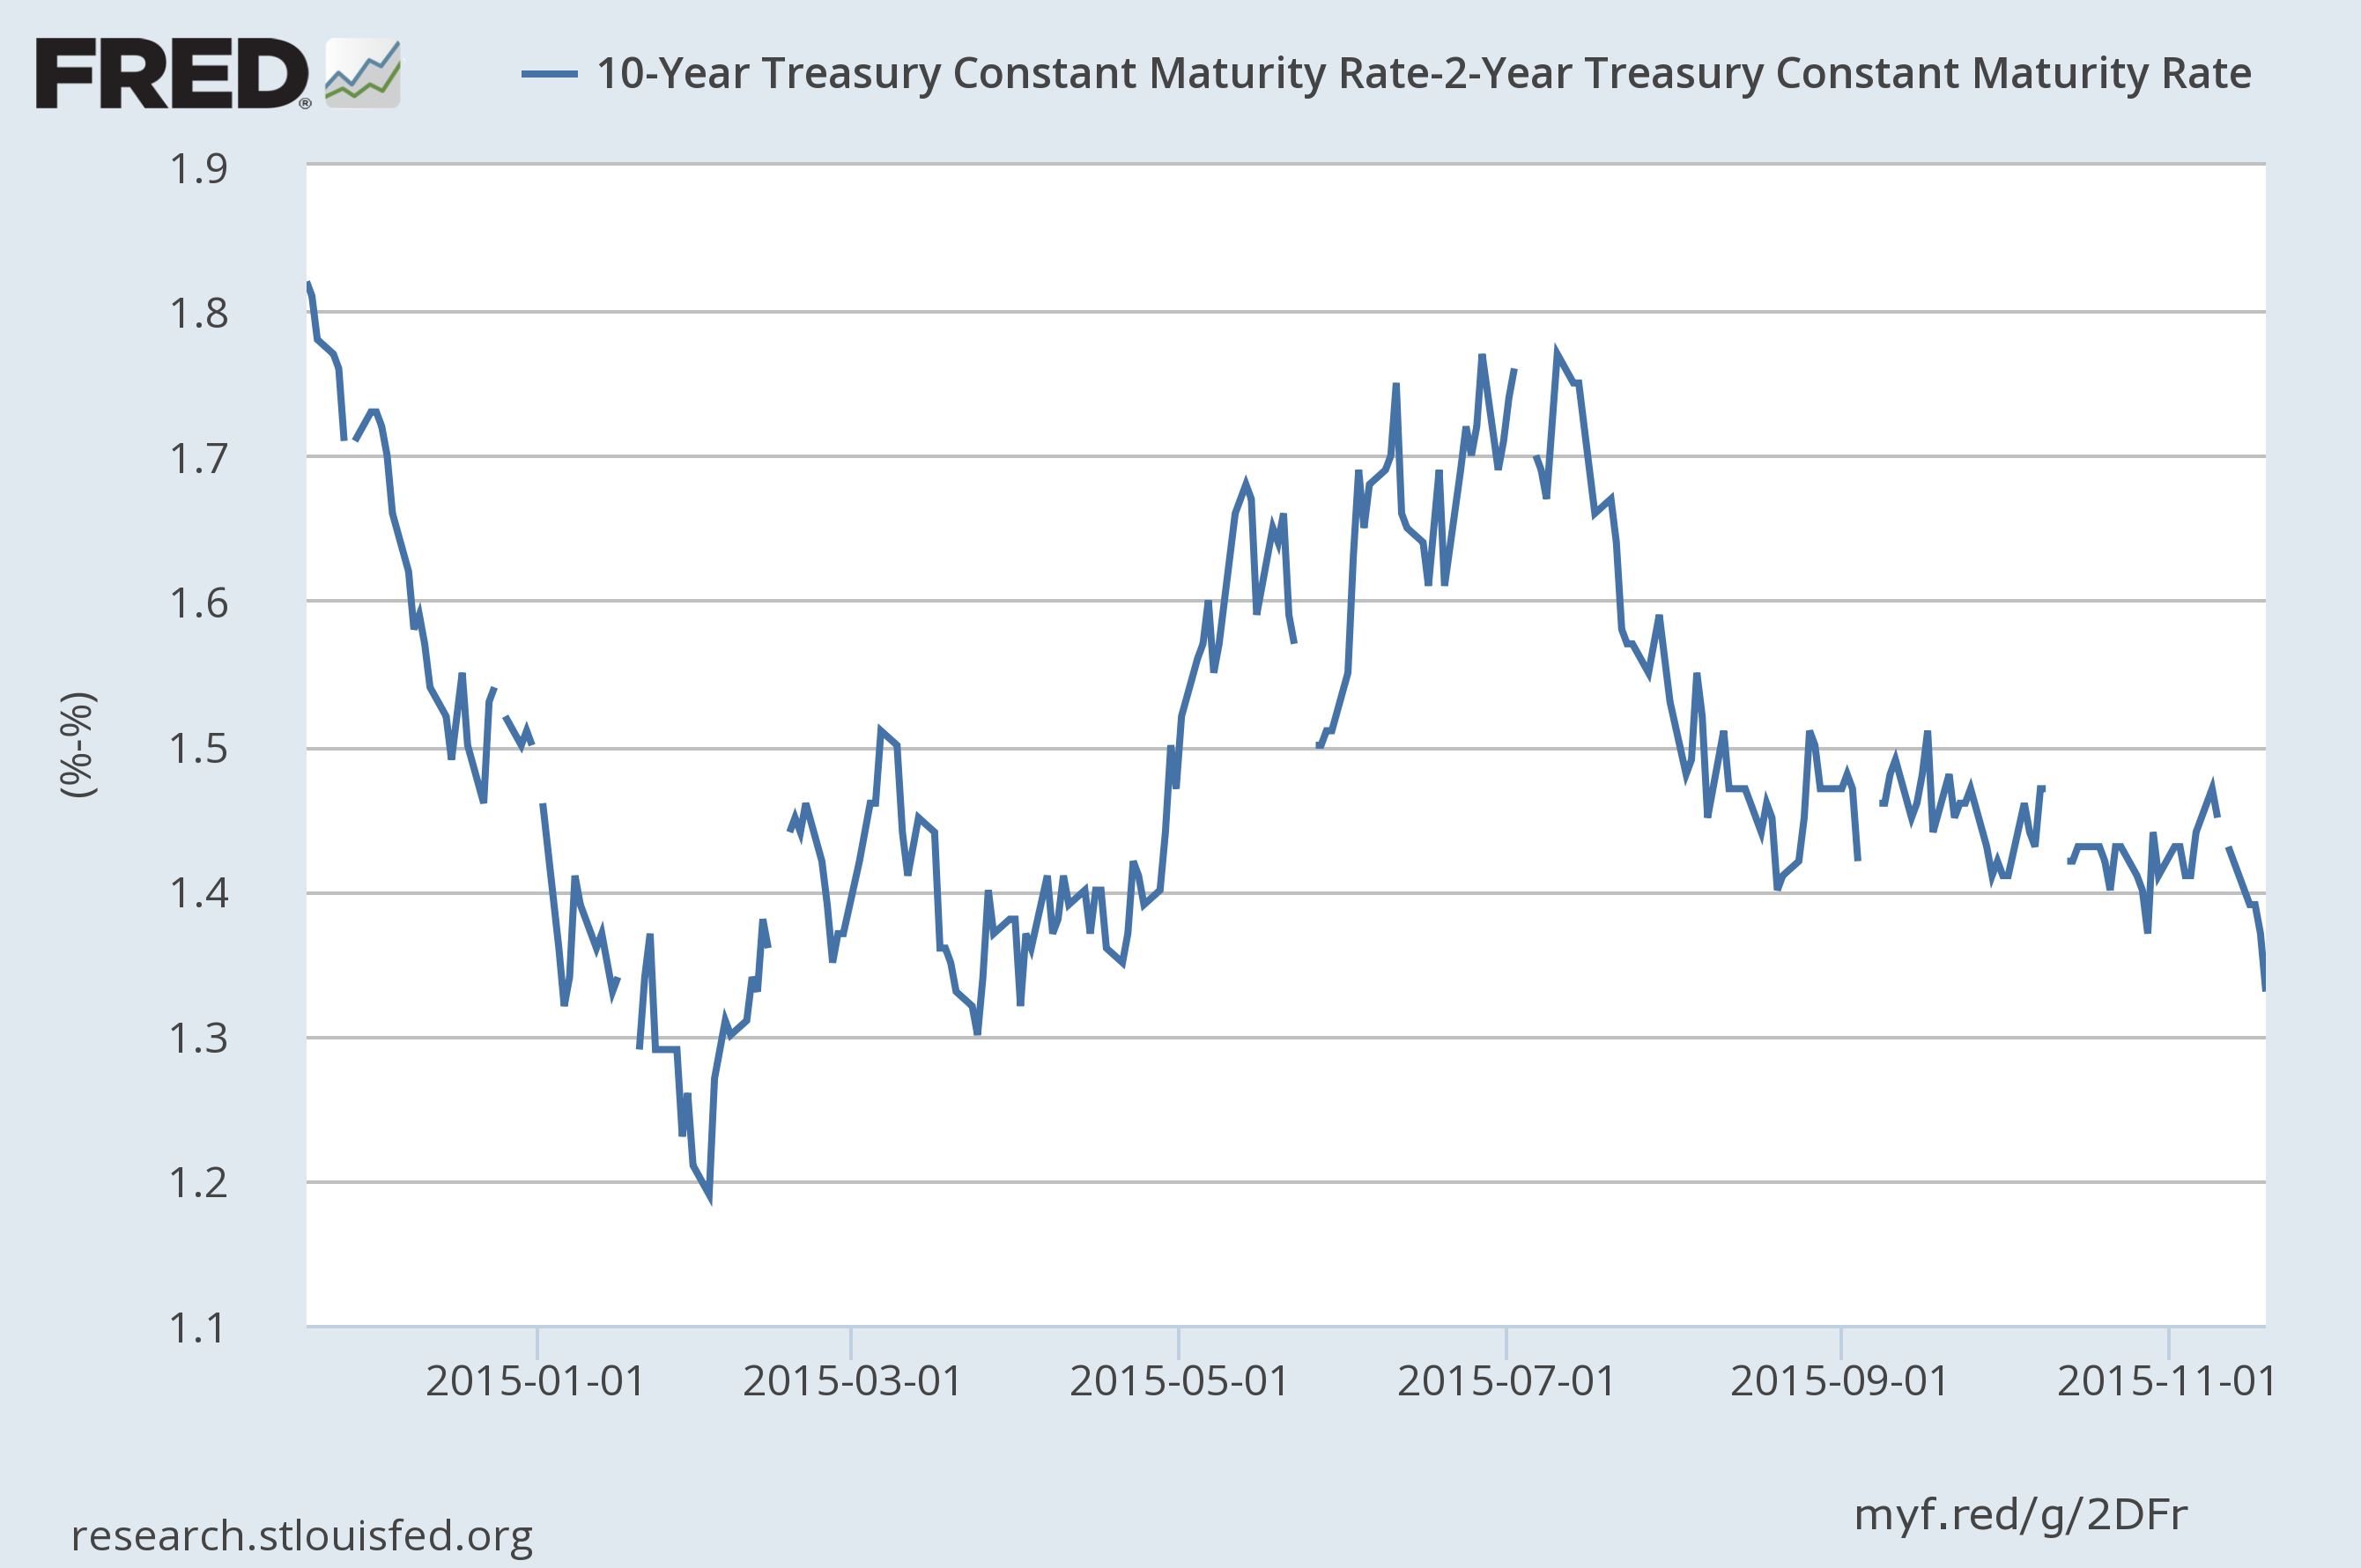
In fact, as the two charts above show, the 30-2 and 10-2 spread have tightened slightly. The only real widening over the last few months has occurred between the 30 and 10 year:
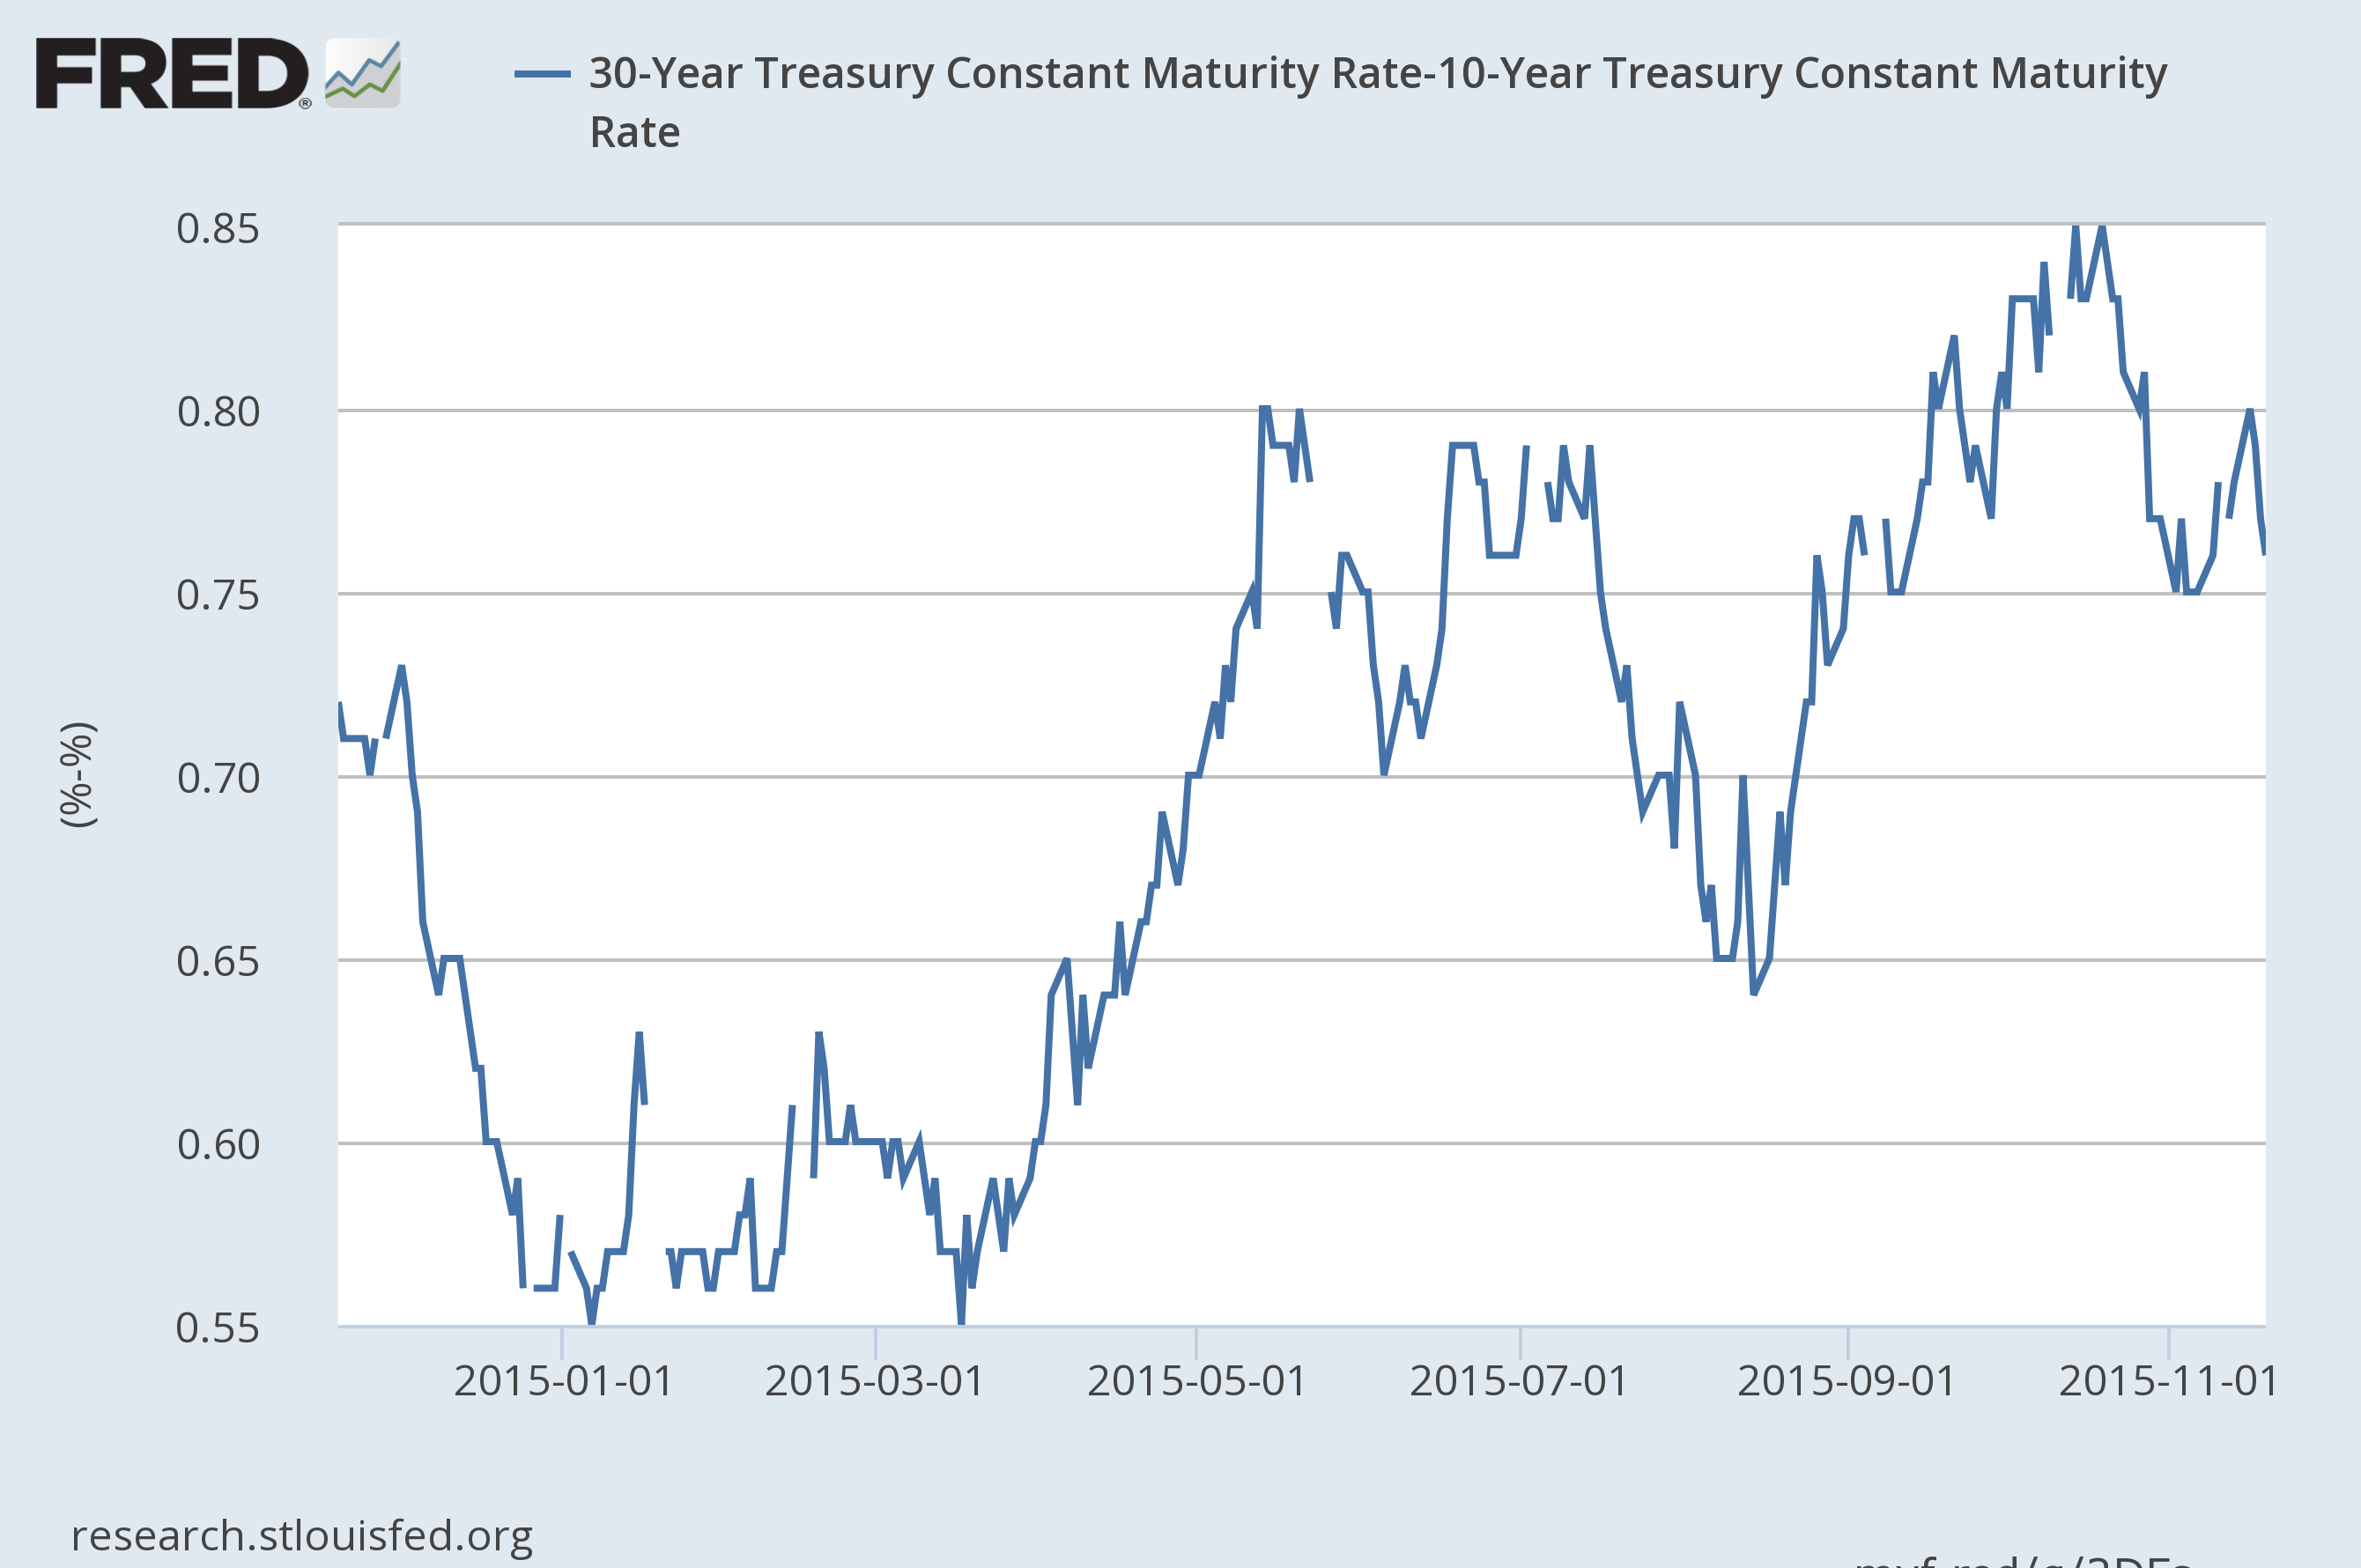
There are three reasons why the long end of the curve would sell off.
- A belief that inflation was increasing. This clearly isn’t happening.
- A belief that a higher rate of growth is about to happen. There is little reason so see growth beyond 2.5%.
- A belief that a Fed rate hike is very probable. This is clearly the primary driver of the sell-off.
But there is no reason to think the Fed will increase rates quickly, which limits the selling action.

