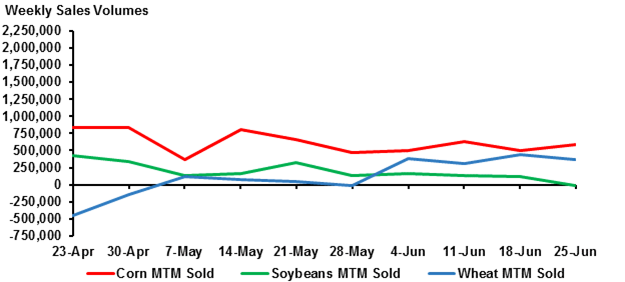
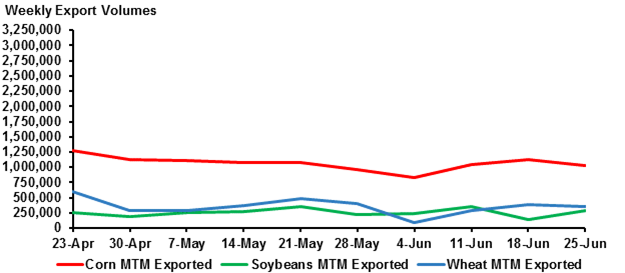
The bumper soybeans crop produced last year has made the global soybean market very competitive. U.S. Soybean sales have struggled under the strong U.S. dollar, reporting their second sales reduction in three months. Wheat sales declined from last week, but corn sales improved. Soybean exports improved, rebounded from the near marketing year low reported last week. Corn and Wheat sales both decreased from last week.
The USDA Stocks and Acreage report released Tuesday caused significant price increases in the grain market. Corn, soybean, and wheat prices all jumped considerably following the report. Corn and soybean stocks and planted acres estimates fell short of analyst expectations causing prices to increase. Wheat estimates were above analyst expectations for stocks and planted acres, but wheat prices were supported by the corn and soybean price rallies.
Weekly net corn sales for the 2014/15 marketing year were 594,300 metric tons (MT), a 20% increase from last week, but an 8% decrease from the prior 10-week average. Increases were reported from Japan, Mexico, Egypt, Colombia, South Korea, Iran, Canada, and Guatemala. Decreases were reported from unknown destinations, the Dominican Republic, Honduras, and the Leeward and Windward Islands. Exports were 1,024,900 MT, a 9% decrease from last week and a 4% decrease from the prior 10-week average. The primary destinations were Mexico, Japan, Egypt, Iran, and China.
Weekly net soybean sales for the 2014/15 marketing year were a 10,300 MT reduction, the third reduction of the marketing year for soybeans. Increases were reported from Taiwan, Indonesia, Japan, Canada, and Mexico. Decreases were reported from unknown destinations, China, Thailand, and Cuba. Exports were 287,600 MT, a 92% increase from last week and a 17% increase from the prior 10-week average. Primary destinations were Indonesia, Mexico, Japan, and Taiwan.
Weekly net wheat sales for the 2015/16 marketing year were 363,900 MT, a 16% decrease from last week. Increases were reported from Japan, the Philippines, Nigeria, Ecuador, and Mexico. Decreases were reported from the French West Indies, Iraq, Panama, and Trinidad. Exports were 362,300 MT, a 7% decrease from last week. Primary destinations were the Philippines, Iraq, Ecuador, Peru, Mexico, and South Korea.
Source: USDA Foreign Agricultural Service
Source: USDA Foreign Agricultural Service
The data for the report was taken from the July 2, 2015 USDA Export Sales report for the week ending June 25, 2015. The information reported is an aggregate of sales and exports data reported to the USDA Foreign Agriculture Service.


