Summary:
- The FOMC minutes release which showed the Fed is still divided over on the timing of when to begin shrinking its massive balance sheet disappointed the Dollar bulls, although the officials reiterated that the rate rises will be gradual.
- The European Central Bank will release the accounts of last month’s monetary policy meeting at 19:00 BJT(GMT 11:00)and could move the Euro.
- We will also get U.S ADP employment report in June at 20:15 BJT(GMT 12:15). Investors tend to look at the leading indicator and predict what’s coming in the official report due for release on Friday.
U.S. Dollar remained bid on Wednesday, 5, July 2017 before it turned bearish on FOMC’s minutes as the Fed is still divided over on the timing of when to begin shrinking its massive balance sheet, although the FED reiterated that the rate rises will be gradual. We will get ECB minutes of last monetary policy meeting in June, U.S ADP employment report in June and ISM non-manufacturing surveys. You may keep an eye on crude inventory report from EIA as an oil trader.
Technical
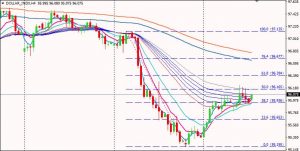
The dollar index (DXY) tested resistance around 60-period EMA on its H4 chart at the first place Wednesday before the strength stalled and fell back on the FOMC’s minutes. Its short-term moving averages had penetrated and moved in the range of the long-term moving averages while the slope of the latter flattened. We may consider the range as support and resistance level for the Index, with the lower boundary standing at EMA30 and the upper boundary standing at EMA60. Keep an eye on ADP report to see if it could bring positive momentum to price action and facilitate a breakout.

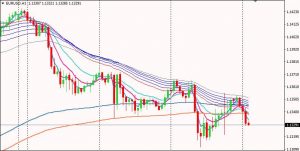
As to non-US currencies, Euro slipped rapidly after it met resistance level at EMA60 on its H1 chart during the Asian and London session. It rallied but could not break above EMA60 after repeatedly tested the resistance level. The currency fell back again today in Asian session with the downside target at EMA 60 on its H4 chart. The Pound declined in Asian trading and then rallied in New York session, mostly followed the direction of the Euro. The short-term upside levels to be watched stand at 1.2937 and then 1.3028 while that of the downside target at EMA60 on its H4 chart. The Aussie dollar, considered as a commodity currency, biased to decline overall. With the upside resistance at a falling trend line on its H1 chart and the downside support level at a rising trend line on its daily chart, keep an eye on these levels and see if the price actions continue to move sideways.

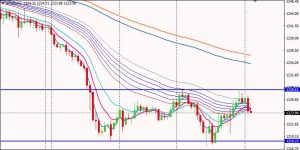
Let’s take a look at the precious metals. The gold declined and hit a new low from 3, July before it jumped, with the MACD in a state of bullish divergence both on its H1 chart and H4 chart. The on-going rallies were held by EMA60 on its H1 chart. It is reasonable to believe that the gold could trade and consolidate in a rectangle candlestick pattern without extending the rally further.

Disclaimer: The views and opinions expressed in this article are those of the authors and for the purpose of reference only, and shall not be relied upon by investors in making any trading decisions.
