We saw a pretty choppy and frustrating week overall for stocks and markets with only very select stocks working while others didn’t work at all.
We’ve had some great setups lately only to see most fail while some have worked well, but overall, it’s been a tough market and really hard for most people.
These tough markets always lead to good ones in time but it’s been a long time now.
That said, we are on the cusp of another earnings season and we always see some nice moves when companies report and hopefully that will be the spark we need to have a nice push into May.
Spring is a strong time of year historically but history doesn’t always rhyme.
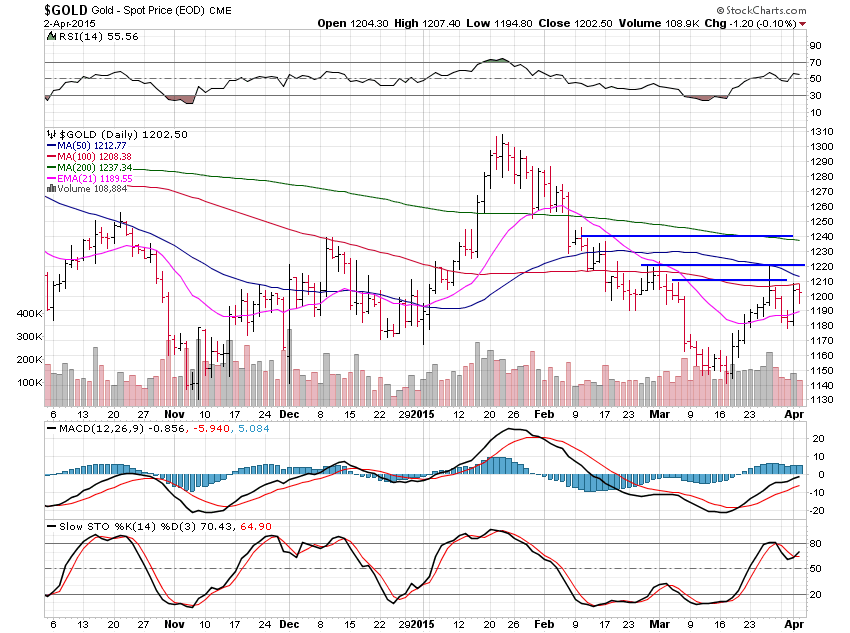
Gold had a great bounce Wednesday and is up at key resistance levels once again but until it can move a bit higher, the trend remains lower.

Gold gained 0.35% during the short week after bouncing off the $1,180 support level.
Heavy resistance sits at $1,220 and also here at $1,210.
Hard quick bounces don’t usually last while breakouts above solid patterns with heavy volume do.
So, now we wait and see if gold can break above this U pattern or if we continue lower.
Until we get above $1,220, the short-term trend remains lower and the long-term trend is definitely lower still.
If we best $1,220 there is heavy resistance and the 200 day moving average at $1,240 so upside may be limited for a while.

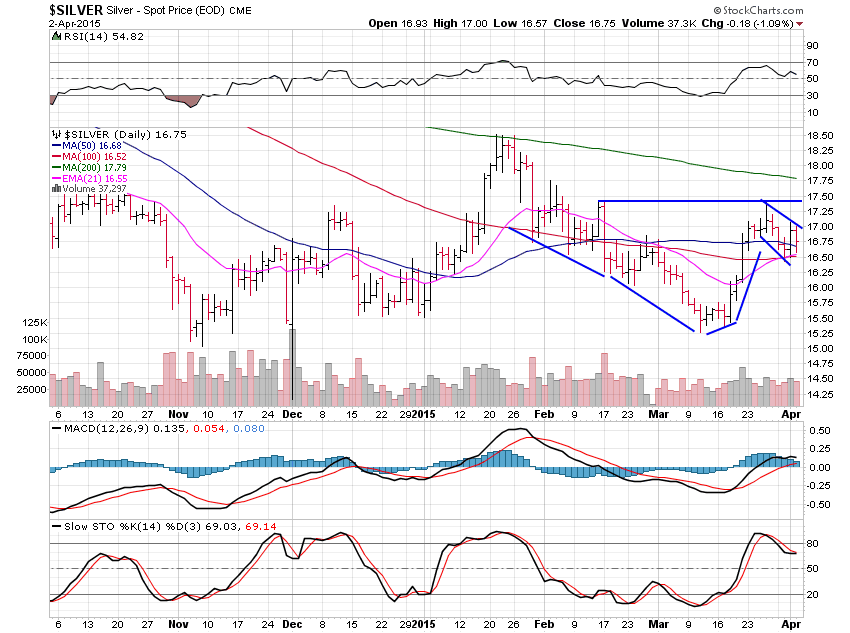
Silver lost 1.30% over the week and seems to be setting up for a move higher still.
We’ve got heavy resistance at $17.50 and $17.75 but, not to jinx it, we could be setting up a cup and handle pattern, which is very powerful.
The best cup and handles are continuation patterns to the upside and into new highs which this isn’t.
The cup and handle I have drawn on this chart is a small one within a larger one starting back in January.
There is no major buy setup here yet, but in a month or so we may see a major handle setup around the $18 area where a breakout would be a signal that the dominant trend down is reversing to up.
You can draw the same type of pattern on the gold chart but it is much cleaner on silver and it’s nice to show a couple viewpoints.
A break above $17 in silver should quickly see $17.50 and above that is $17.75 resistance so it isn’t the right setup for me to get involved yet but a small position with a longer-term view could work, and if it does, adding on a major breakout next month or so could be a stellar trade.
Only time will tell and it does take time to put in bottoms and we’ve been working on this one since November 2014.
That said, we’ve not seen the true capitulation bottom I’d love to see.

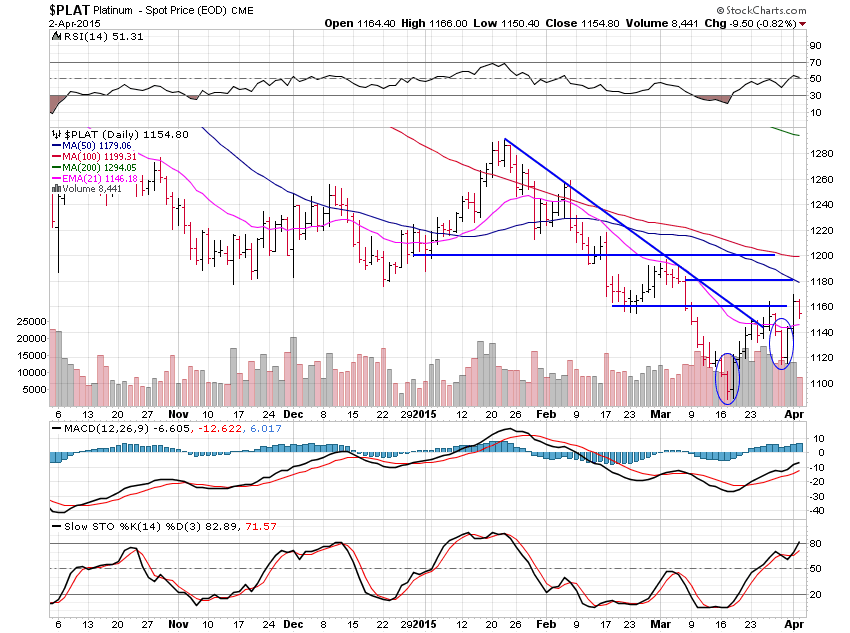
Platinum gained 1.27% this past week and gave a major buy signal on Tuesday.
When something breaks a major trend-line and then moves back into it, but fails and reverses higher again, it is a very strong signal and that is what platinum did this past week.
As always, platinum depends on how gold moves so we have to take this action with a grain of salt but it is a very positive development.
Platinum led gold years ago and this action is something to watch in that it may be resuming it’s long forgotten leading role.
For now, resistance sits above at $1,160, $1,180 then $1,200 where the 100 day moving average lies.

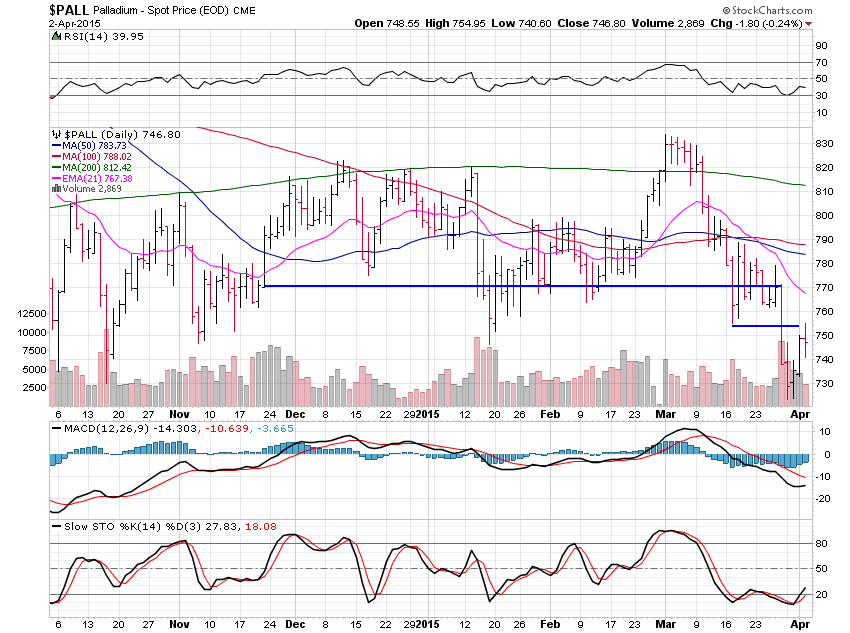
Palladium gained 1.21% this past week following in golds trail.
Resistance sits above $770 then $780 and major resistance at the $790 area.
Bottoms are hard to put in with so many resistance levels and moving averages above so it takes time and this chart is the worst of the precious metals bunch this weekend but it will follow gold.
I hope you have a great, well deserved long weekend.