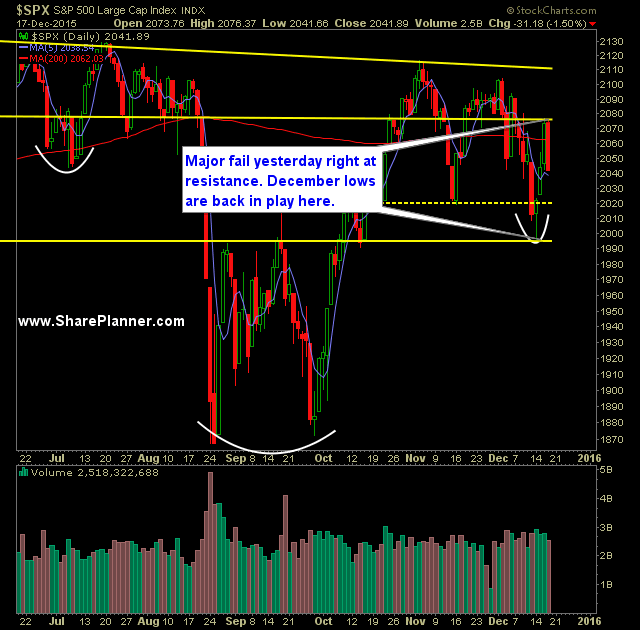
- Yesterday's sell-off raised eye brows, because even with the selling early on, it appeared as if SPX would rally out of the base it was forming at the lows of the day, but the last hour of trading in particular completely derailed those plans and completely changed the look and feel of this market.
- Bearishness rapidly increased yesterday across the market, but this is also the one time of the year where getting short this market is so completely skewed against the trader in terms of being successful.
- Today is quadruple witching/options expiration. There may be additional volatility as a result.
- Volatility spiked hard off of its lows of the day going from 16.13 up to 18.94 - a 17% move off of its lows of the day.
- T2108 (% of stocks trading above the 40-day moving average) looks like it may have finished off a dead cat bounce with a 14 point decline down to 25%.
- Bulls must hold 2039 which is the lows of the 30 minute trading range from this week.
- Yesterday's price move on (N:SPY) represented a massive bearish engulfing candle pattern. Very concerning, and took place right at price resistance.
- SPY volume was again, extremely high.
- Surprisingly, the 5-day moving average is still beneath current price action.
- A lot of talk about the "Golden Cross" taking place on SPX with the 50-day moving average crossing above the 200-day moving average. I don't put much weight behind this phenomenon.
- Island reversal pattern has formed on the daily SPY all the way down to the 1 minute chart. This is a very bullish pattern for the market and could very well mark the bottom to the recent selling.
- S&P 500 has followed a similar path to that of 2014, in fact it is eerily similar with both sell-offs being within 3 points of each other in terms of sell-off depth.
- 2014 ripped higher following this sell-off for the remainder of the year.
- Also an interesting analog for 2015 has been its similarity to 2011 price action.
- For twelve years straight, the market over the course of the last 30 trading days of the calendar year, has yielded a net positive gain, and thus reinforcing the concept of the "Santa Rally".
- Closed out ProShares UltraPro S&P500 (N:UPRO) yesterday at $63.28 for a 5.7% profit.
- Closed out ProShares Ultra QQQ (N:QLD) yesterday at $79.21 for a 3.6% profit.
- Closed out Becton Dickinson and Company (N:BDX) yeserday at $156.21 for a 0.8% profit.
- Closed out Applied Materials Inc (O:AMAT) yesterday at $18.12 for a 1.5% loss.
- Added one new long position yesterday.
- I may add long/short positions today based on direction and strength/weakness of t his market.
- 40% Long / 60% Cash
- Remain long: Microsoft Corporation (O:MSFT) at $54.81 and three other positions.
My Trades:
Original post
3rd party Ad. Not an offer or recommendation by Investing.com. See disclosure here or
remove ads
.

