Get 40% Off
🤯 Perficient is up a mind-blowing 53%. Our ProPicks AI saw the buying opportunity in March.Read full update

Tight Trading Covered Last Weeks Action

Published 05/26/2015, 12:14 AM
Updated 07/09/2023, 06:31 AM

Friday didn't bring a flourish of buying or selling into the long weekend, so it's up to Tuesday to price in weekend news. Opportunities are available for both bulls and bears.

Bulls will be looking to the S&P 500 to push from 5-day days of tight, sideways pattern in an effort to put some distance to 2120. Technicals are mixed, with a strong 'buy' in the MACD and bullish momentum, offset by a 'sell' trigger in On-Balance-Volume and some mixed action in the ADX. One point of note is the bullish cross in relative performance against the Russell 2000.
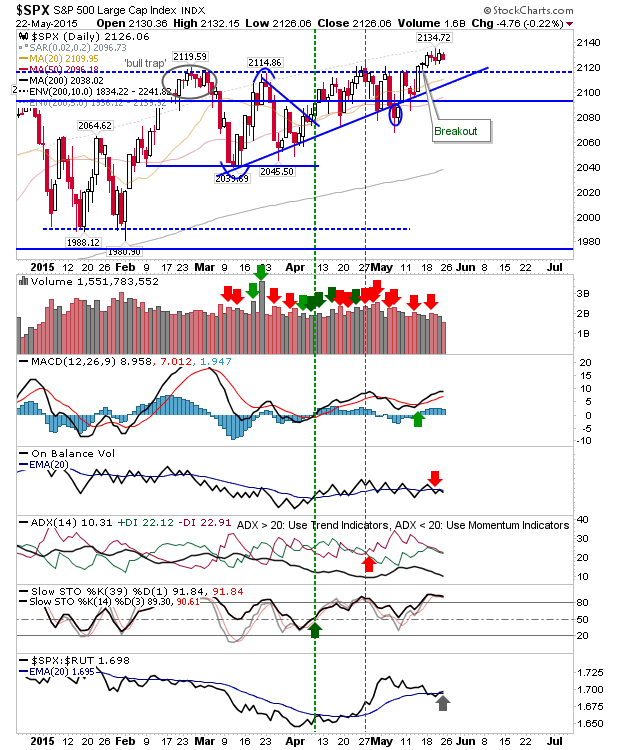
S&P 500 Daily Chart


In the bears camp is the NASDAQ. While it has managed to hold 5038 support it has resistance at 5096 to contend with. This may give bears a chance to sneak a quick trade in, looking for a move to retest support of what is increasingly looking like a rising (bearish) wedge. With the exception of the ADX, all supporting technicals are bullish. In addition, the index is outperforming the S&P. Collectively, there may be enough to keep shorts honest, as buyers look to drive past 5096 and on to new highs.
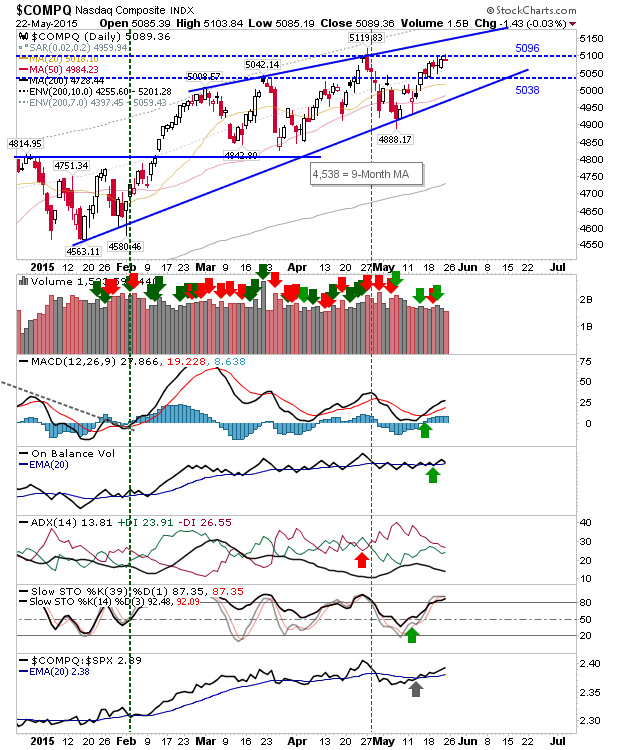
Nasdaq Daily Chart


Although bears can also look to the Percentage of Nasdaq Stocks above the 50-day MA as a marker for further weakness. Note the reversal from 54% resistance; the way this is heading it won't be long until there are fewer than 50% of component Nasdaq stocks above their 50-day MA.
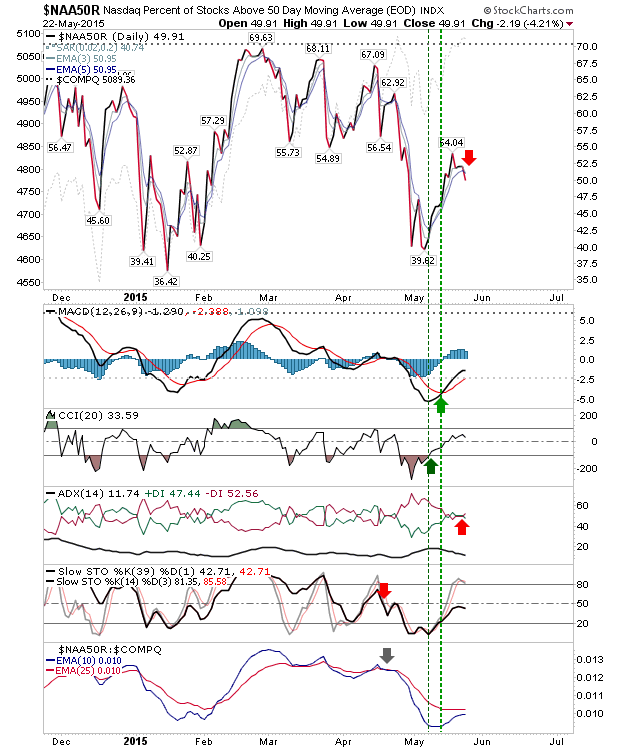
Nasdaq Stocks Daily Chart


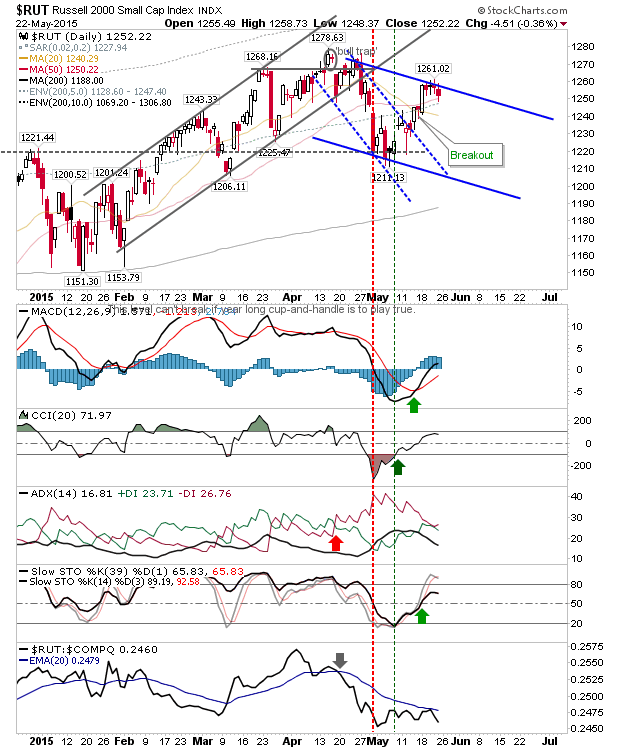
Bears may also be looking at the Russell 2000. There is a potential new bearish channel taking shape with the 50-day MA providing the current support. The channel hasn't been confirmed (3 touches of resistance are required), but if Tuesday opens weak then shorts will be clustering their stops around 1,261. Technicals are bullish, but not strongly so.
3rd party Ad. Not an offer or recommendation by Investing.com. See disclosure here or remove ads .

Russell 2000 Daily Chart


Shorts may have the easier time of it on Tuesday, but any profit taking which takes hold will probably run into buyers sooner rather than later. The slow drip action of markets is favouring bulls, who have little incentive to sell. It would probably take 3 consecutive big red candles to put bulls in a position where they would feel the need to sell rallies. It's all very tight at the moment.

Latest comments

Risk Disclosure: Trading in financial instruments and/or cryptocurrencies involves high risks including the risk of losing some, or all, of your investment amount, and may not be suitable for all investors. Prices of cryptocurrencies are extremely volatile and may be affected by external factors such as financial, regulatory or political events. Trading on margin increases the financial risks.
Before deciding to trade in financial instrument or cryptocurrencies you should be fully informed of the risks and costs associated with trading the financial markets, carefully consider your investment objectives, level of experience, and risk appetite, and seek professional advice where needed.
Fusion Media would like to remind you that the data contained in this website is not necessarily real-time nor accurate. The data and prices on the website are not necessarily provided by any market or exchange, but may be provided by market makers, and so prices may not be accurate and may differ from the actual price at any given market, meaning prices are indicative and not appropriate for trading purposes. Fusion Media and any provider of the data contained in this website will not accept liability for any loss or damage as a result of your trading, or your reliance on the information contained within this website.
It is prohibited to use, store, reproduce, display, modify, transmit or distribute the data contained in this website without the explicit prior written permission of Fusion Media and/or the data provider. All intellectual property rights are reserved by the providers and/or the exchange providing the data contained in this website.
Fusion Media may be compensated by the advertisers that appear on the website, based on your interaction with the advertisements or advertisers.
© 2007-2024 - Fusion Media Limited. All Rights Reserved.