With just one week left before Americans go to the polls, every investor in the country is getting sucked into election season drama.
And drama is exactly what we have.
Sellers sent stocks reeling last Friday afternoon, as news broke that the FBI is preparing to dig through 650,000 of emails from top Hillary Clinton aide Huma Abedin – emails that were found on the laptop of Abedin’s sexting-aficionado ex-husband, Anthony Weiner.
With Weiner back on the front page, this election has turned into a three-ring circus.
You couldn’t make this stuff up if you tried. And as Clinton’s dominant lead shrinks amid the expanding email scandal, the stock market doesn’t like it one bit.
Investors are spooked.
Stocks acted poorly in October and we’ve seen sellers drag down some of the most vulnerable stocks and sectors as a result.
Just a few short weeks ago, we showed you how positive momentum in a couple of key groups of stocks was bubbling up under the market’s surface.
Our theory was the market was quietly shifting to “risk-on” mode while most investors were too scared to act.
The evidence was all around us, too. Investors were ditching safety plays like utilities and consumer staples stocks that were so popular earlier in the year. Even the price of gold fell off a cliff.
But our risk-on indicators aren’t improving. In fact, a few are even beginning to break down. Here are three charts that are scaring the bejesus out of investors as we enter November:
1. Small Stocks Fall Off a Cliff
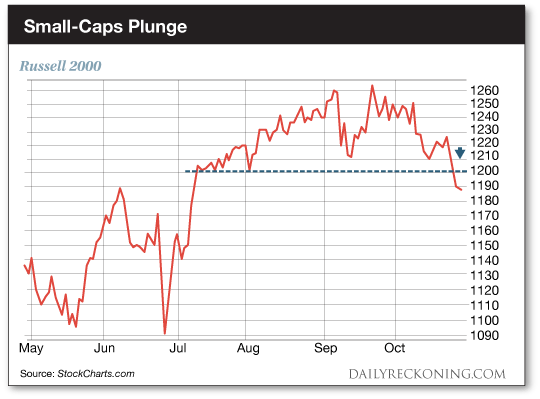
We’re always keeping a close eye on small-cap stocks. If smaller companies are performing well, it’s usually an indication that investors are feeling bullish.
A couple of months ago, small-cap and microcap names were finding new life and spanking the major averages. But not anymore.
Last Thursday’s big push lower dropped the Russell 2000 small-cap index to three-month lows. And four straight days of losses nudged the Russell below a key support level. See for yourself below…

The S&P 500 finished down 1.9% in October. The Russell 2000 dropped 4.8%. That’s not exactly bullish.
2. Biotechs Can’t Bounce
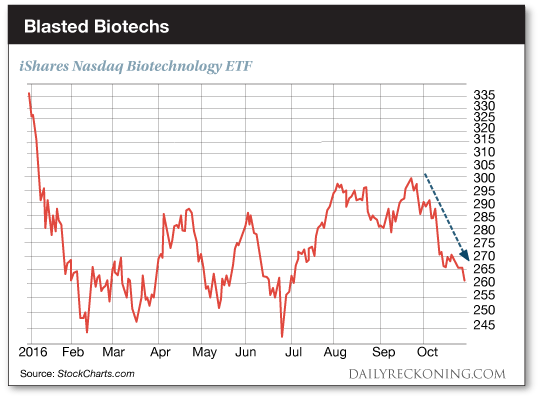
Biotech stocks quietly crept higher in September as the major averages remained trapped in the spin cycle.
But investors wanted nothing to do with speculative biotech names in October. Like small caps, these former standouts are quickly deteriorating…

As you can see, biotechs rebounded strongly off their post-Brexit lows in June. But all the hard work is beginning to evaporate.
We talked about how biotech stocks are quickly becoming one of the market’s big “tells” just a few weeks ago. The sector has been one of the hardest hit areas of the market over the past couple of years, but it enjoyed a nice summer rally.
Now that the summer strength is gone, though, we’re left watching these speculative names push to three-month lows.
3. Breadth Continues to Deteriorate
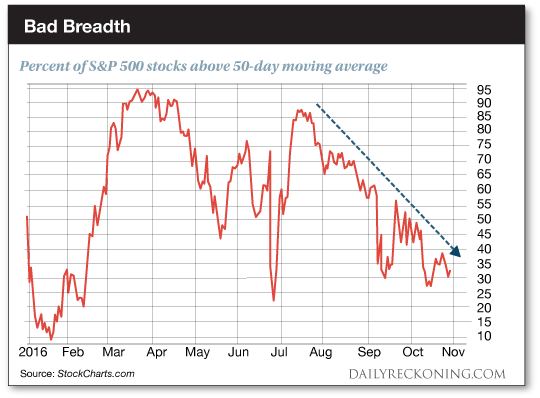
When market rallies occur, we want to see broad participation among stocks, not just a few big names driving the gains.
Right now, however, we’re seeing just the opposite. Fewer and fewer stocks are in well-defined uptrends. And that ain’t bullish, my friend.
The percentage of stocks in the S&P 500 above their 50-day moving averages has shrunk substantially since the market rocketed off its June lows. Check it out…

At the moment, fewer than 35% of large-cap names are above their respective 50-day moving averages. We’ll need to see a bounce in this indicator before we can put full trust in any market rally.
With October in the books, our job is to figure out whether the month’s bearish action is the final shakeout before a year-end rally… or the beginning of a bigger drawdown.
Keep an eye on these three charts. They’ll tell you almost everything you need to know about the market.
