The Yen Breaks Out
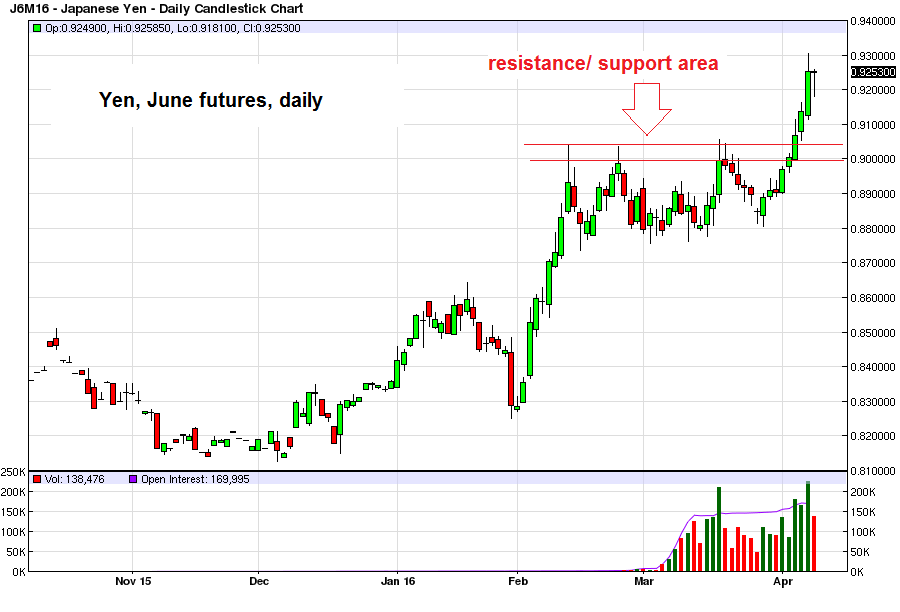
A few days ago we discussed the yen’s trend change and what appeared at the time to be an imminent breakout. This breakout has now actually occurred, and looks quite convincing to us.
If a pullback to the former resistance (now support) area highlighted below should occur, it should probably be bought. This may not happen, but given that Kuroda-san is probably not happy with this move, we expect him to act to counter it, which could induce a correction and retest.

Yen, June futures contract, daily – the breakout is in the bag – click to enlarge.
At its recent lows, the real exchange rate of the yen in trade-weighted terms was close to levels last seen in 1973, so it is fair to say that the yen is currently quite undervalued relative to other fiat currencies. Moreover, the BoJ consistently fails to persuade Japanese banks to expand credit, which puts a damper on money supply growth in the non-financial parts of the economy.
Add to that the fact that the yen’s rally looks technically even more convincing now, and we have all the ingredients of what could eventually become a much bigger move than most observers currently expect.
A Subtle Stock Market Signal
As we have mentioned on Tuesday, a stronger yen usually doesn’t bode well for stocks. We once again should warn that such correlations are never valid “forever”. The only thing one can always expect to happen in financial markets and the economy is constant change.
Still, given recent experience, we are wary that yen strength could be a sign that the recent party in “risk” will soon be derailed. On the other hand, we have to acknowledge that market internals have greatly improved due to the recent strong bounce in the commodity and industrial sub-sectors. At the same time, defensive sectors have only surrendered very little of their previous gains.
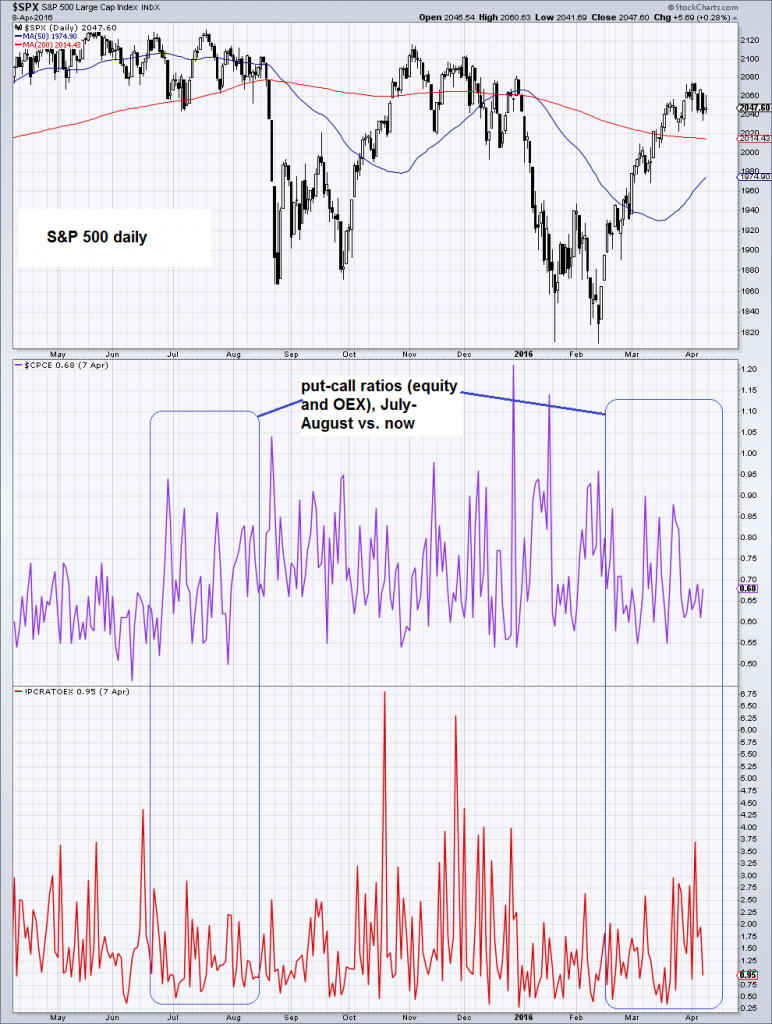
Options markets are largely in “neutral” mode – there is neither a great deal of enthusiasm in evidence, nor is there much fear. A similarly meaningless backdrop in options could however be observed in the July-August period as well, so this doesn’t necessarily mean much.

SPX daily: the SPX has returned into the area of congestion that contained it prior to the January sell-off. Put-call ratios look largely neutral at present, which is quite similar though to what they looked like shortly before the late August break – click to enlarge.
As we noted at the time of the interim lows in early to mid February, there was elevated crash risk due to the market’s proximity to important medium term support levels. However, once this risk had passed, we expected the SPX to rally back close to one of the previously established resistance areas.
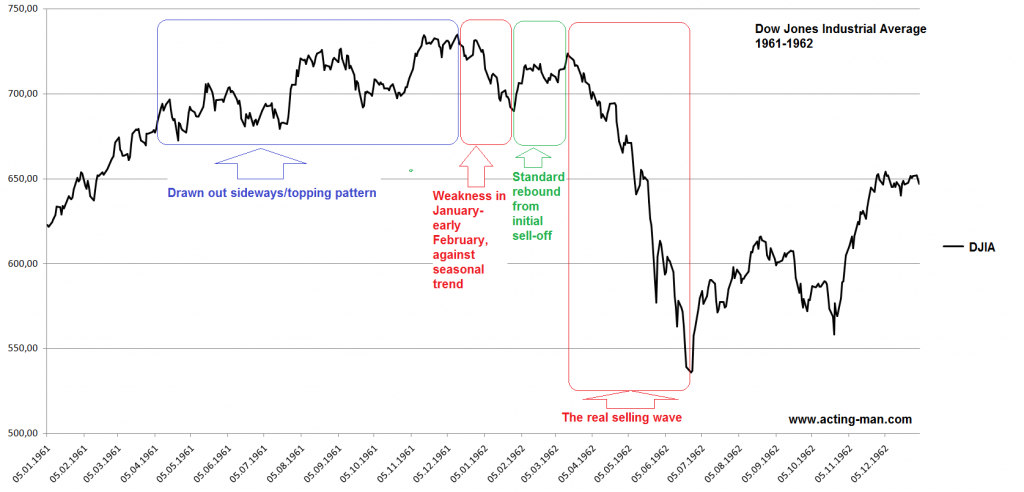
It has in fact gone quite far in the meantime, by moving right back into the congestion zone it inhabited prior to the January breakdown. This continues to be in keeping with the 1962 and Nikkei 1990 analogs, which we have previously discussed (both examples for “unseasonal” market weakness in early January).
These analogs call for the next interim peak to be established sometime in the March to May period. If these models remains applicable (which is of course far from certain), then we are now in the phase designated “standard rebound from initial sell-off” on the chart below:

DJIA, 1961 – 1962: after a bout of weakness in early January, a rebound brings the market nearly back to its previous highs, and then a large selling wave commences – click to enlarge.
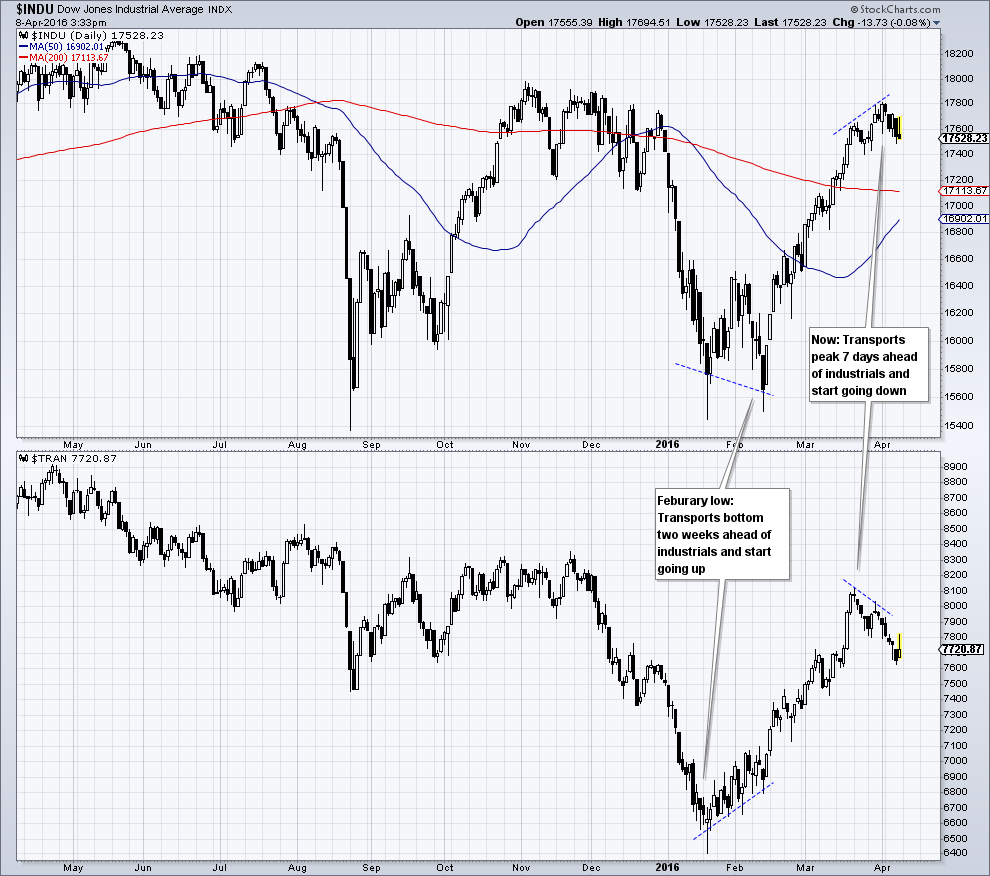
Looking back to the February low, one had to look for subtle clues that might indicate whether the lows would or wouldn’t hold, given the heightened crash risk at the time (that the lows would hold was always the higher probability outcome of course, but caution seemed definitely advisable). One of these signs was that previously weak sectors that had been downside leaders started to outperform the rest of the market.
This was e.g. evident when comparing the DJIA to the Transportation Average. This is worth noting because the two averages have recently diverged again – only, the other way around. Here is a chart illustrating these divergences:

Short term divergences between the DJ Industrial Average and the Transportation Average. A bullish divergence occurred at the February lows, whereas a slight bearish divergence is in evidence currently – click to enlarge.
Conclusion
Will this turn out to be meaningful? This is of course not certain yet – but we note that while market internals generally remain strong for the moment, Nasdaq Composite and NDX also continue to lag the recent advance. Add to this the yen’s show of strength, and we have at the very least good reason to treat this as a “heads-up” type of signal.
Note also that the S&P 500 Index is just above its still declining 200 day moving average, in a position quite similar to that of the November – December period. Perhaps there will be a similar period of back-and-forth trading until the 50 day moving average catches up with the 200 day m.a., as it has done in December – timing-wise, this could well happen close to the next FOMC meeting later in April.
