Highlights
Market Movers: Weekly Technical Outlook
Technical Developments:
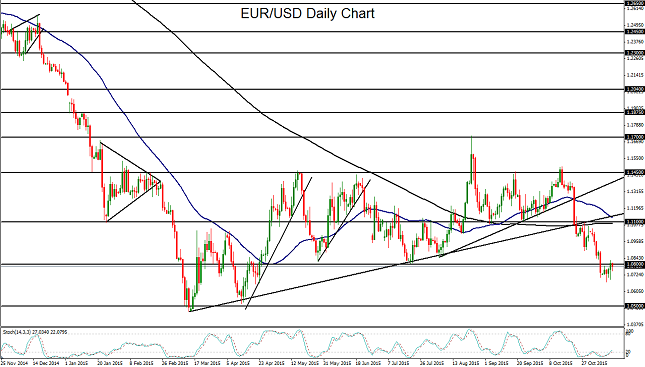
- EUR/USD remains pressured to the downside despite having retested the key 1.0800 resistance level to the upside. Technical bias: Bearish
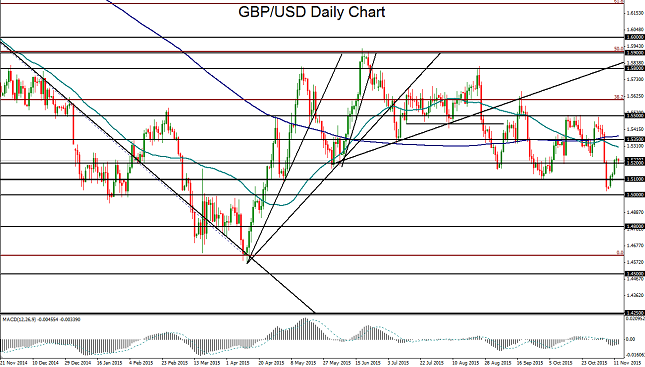
- GBP/USD rebounded this past week but maintains a moderately bearish outlook towards 1.5000 and below in the run-up to December and the Fed rate decision. Technical bias: Moderately bearish
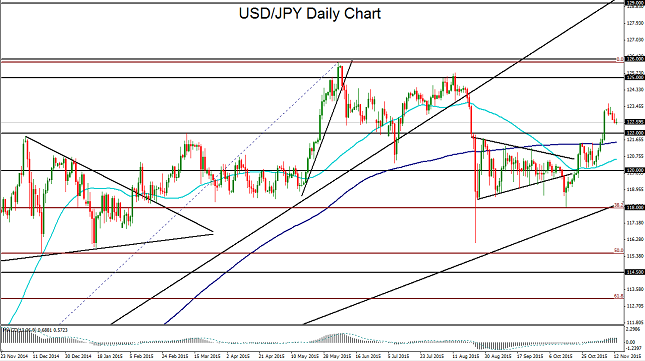
- USD/JPY may have exhausted its recent sharp bullish move and could see a continued pullback towards the major 122.00 support/resistance level on equity market volatility. Technical bias: Neutral to bearish
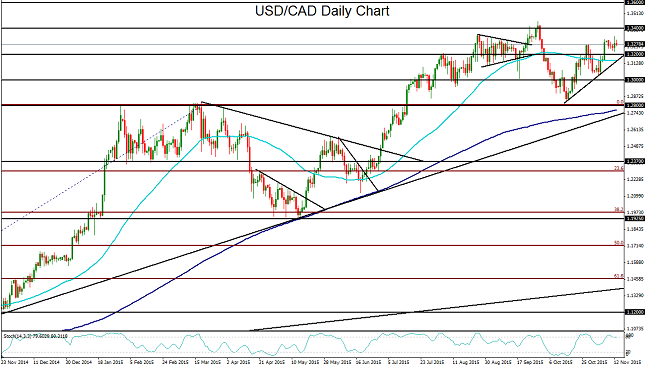
- USD/CAD could be eyeing its multi-year highs above 1.3400 once again as the US dollar continues to be supported and crude oil continues to be pressured. Technical bias: Bullish
EUR/USD
EUR/USD spent most of this past week trading in a relatively tight range just under the 1.0800 level after the previous week saw a sharp plunge below 1.0800. Late on Thursday, however, the currency pair rose slightly above this resistance level, even after European Central Bank (ECB) President Mario Draghi earlier delivered some dovish remarks indicating the ECB’s willingness to extend its stimulus measures in the form of further quantitative easing. Despite this retest of 1.0800, the longer-term outlook continues to be strongly bearish, especially in light of the divergence in monetary policy between the dovish-leaning ECB and the hawkish-leaning Fed. For the past month since mid-October, EUR/USD has been entrenched in a steeply declining trend, and this should continue if the currency pair manages to sustain trading below the key 1.0800 level. In the run-up to December’s Fed meeting, further Fed-driven dollar-support and the likelihood of more stimulus measures from the ECB could place EUR/USD on a track towards 1.0500 support, near March’s long-term lows. Any further downside momentum below 1.0500 could move the currency pair towards its long-term target at parity (1.0000).
Source: FOREX.com
GBP/USD
GBP/USD managed to stage a sharp rebound this past week after having plunged sharply during the previous week. Despite this rebound, the currency pair continues to carry a moderately bearish bias due to the fact that the US Federal Reserve is perceived by the markets as significantly more hawkish than the Bank of England (BOJ), even though both are expected to begin their respective monetary tightening cycles sometime before the end of next year. Of course, the Fed is now widely anticipated to begin instituting its rate hike cycle in December, while the BOJ is not expected to do so until well into 2016. Having risen this past week back above the 1.5200 handle from the previous week’s low just above 1.5000, GBP/USD could soon begin to revert back to the downside if the US dollar continues to be supported by a hawkish Fed. In this event, the next major downside target continues to be at this 1.5000 level, followed by the 1.4800 support objective.
Source: FOREX.com
USD/JPY
USD/JPY pulled back modestly this past week after the previous week saw a sharp surge of dollar strength that was further extended by a much stronger than expected US non-farm payrolls employment report. This week’s USD/JPY pullback also coincided with a pullback in the equity markets. While the outlook for the US dollar continues to be generally bullish, at least until the mid-December Fed meeting when the markets will finally know if there will be a rate hike this year, the directional fate of USD/JPY is also partly dependent on the performance of the global stock markets. Having reached a high of 123.60 this past week, USD/JPY could well have exhausted its sharp bullish move for the time being. With the return of stock market volatility, USD/JPY could be poised for a retreat back down to key 122.00 support. Any breakdown below 122.00 could see a further drop towards the 120.00 psychological level. In the event of a resumption of USD/JPY strength after this past week’s pullback, major resistance to the upside resides around the 125.00 level.
Source: FOREX.com
USD/CAD
This past week saw USD/CAD trade in a relatively tight trading range after having risen from key 1.2800 support for the past month. This rise has been partly supported by a strong US dollar that has ridden a wave of renewed speculation over a Fed rate hike in December. It has also been supported by persistently weak crude oil prices that have weighed heavily on the energy-correlated Canadian dollar. With this combination of low oil prices and a Fed-supported US dollar, USD/CAD could soon be poised to make a run at September’s 11-year high of 1.3456. Any further push above that high could then target the 1.3600 resistance level, which would confirm a continuation of the longstanding bullish trend.
Source: FOREX.com
Retail sales fails to impress forex traders
There are no two ways about it: the past week was a slow week for foreign exchange traders (though equities and commodities have certainly been more volatile – see below for more). With no top-tier data releases from Europe or the US during the first four days of the week, the US dollar generally consolidated against most of its major rivals over the first 96 hours of the week’s trade.
On Friday, traders were saying TGIF (thank goodness it’s Friday) for at least two reasons: the traditional end of the workweek and the release of the October US retail sales report, which was billed as the marquee data release of the week. As it turns out, even that report was a bit of a dud both in terms of economic and market activity.
US retail sales rose by a subdued 0.1% m/m in October, well below the 0.3% reading anticipated by economists. The “core” retail sales measure, which filters out more volatile automobile purchases, rose 0.2% m/m, weaker than the 0.4% increase anticipated by economists. In terms of the details, sales declined at service stations and electronics stores, held steady at clothing stores, and rose at furniture stores, restaurants, and especially online stores.
Meanwhile, the concurrent producer price index (PPI) report also came in worse than expected, with producer prices actually declining -0.4% m/m against expectations of a 0.2% rise. The “core” PPI reading - which removes the impact of more volatile food and energy prices - also fell, coming in at -0.3% m/m vs. an anticipated gain of 0.1%.
Taken together, these economic reports present more ambiguity for the Federal Reserve heading into next month’s highly-anticipated monetary policy meeting. At this point, the central bank still looks likely to raise interest rates, but if Friday's releases were the start of a run of weak data over the next month, the Fed could still push back its long-awaited rate hike. After all, what’s another month or two after nearly 10 years of 0% interest rates.
Market Reaction
The markets took the data mostly in stride, with the US dollar actually strengthening by 10-20 pips across the board. Meanwhile, US equity futures held steady and continue to point to a slightly lower open. The yield on the benchmark 10-year US Treasury bond ticked down to 2.28% before bouncing back to essentially unchanged at 2.30%. Both gold and oil turned lower on the day, extending their recent bearish streaks.
Moving Forward…
On Friday afternoon, it felt as if traders were eager to put the week to bed and move on to potentially more volatile markets the following week. See our outlook on major markets and the key economic data to start planning your coming week of trade!
Look Ahead: Stocks
After a relatively quieter start on Friday morning, European stocks started to roll over again and were trading near their session lows when this report was written. It was an ugly week for global equities and an even a worse one for commodities. Concerns over a potential rate increase in December from the Federal Reserve is unnerving investors, while a continued soft patch in Chinese data suggests growth in the world’s second largest economy is slowing down more sharply than had been anticipated. In the US, the earnings season is drawing to a close and the results have not been great.
There is little further catalyst to support the markets except the ongoing expectations that the world’s major central banks will remain extremely accommodative for an extended period of time. In fact, the ECB is likely to expand its bond purchasing program and cut rates into the negative in December. And judging by the latest growth figures that were released on Friday, we would certainly not be surprised if it did. But this should ultimately be good news for stocks, although for now the market’s focus is elsewhere. The Eurozone Flash third-quarter GDP estimate came in at +0.3% versus +0.4% expected and down from +0.4% in Q2. On year-over-year terms, GDP was +1.6%, up from +1.5% previously but below +1.7% expected. The latest US macro numbers were likewise far from convicting as both headline and core retail sales rose less than expected while PPI unexpectedly fell. Consequently, traders were left confused as to what the Federal Reserve may do in next month’s highly-anticipated monetary policy meeting.
As things stand, the Fed still remains on course to raise rates but some traders are starting to wonder whether October’s stellar jobs report was a one-off and whether we will start to witness some weaker data next month. So the Fed may yet again delay raising rates and this could provide the market some support it badly needs right now. This week’s key data for stock market participants to keep an eye on will include Monday’s preliminary third-quarter GDP estimate from Japan; the latest German ZEW survey and US Consumer Price Index, both on Tuesday; minutes from the FOMC’s last meeting on Wednesday and then the Bank of Japan’s monetary policy statement on Thursday.
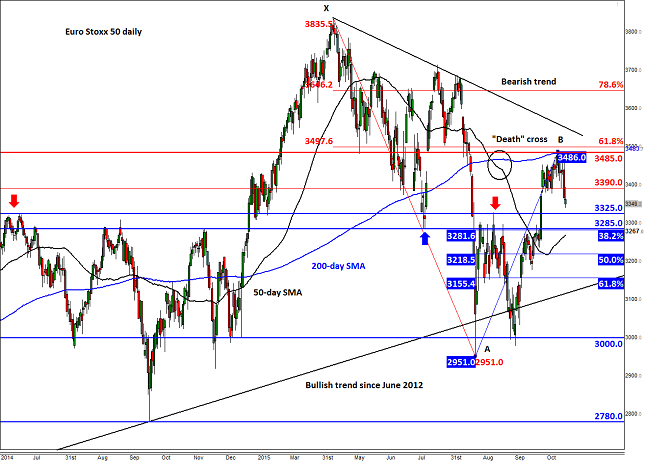
On the technical front, despite the sell-off the Euro Stoxx 50 index is technically still in consolidation as it remains within the converging trend lines, but the outlook is beginning to look bleak. After the last stock market rout at the end of August, the index managed to hold its own above the long-term bullish trend line and found strong support around the 3000 level. Long-term investors may look to again use this latest pullback as an opportunity to increase their holdings, so we need to be wary of becoming convinced that another sharp correction is underway. It may well be, but at this stage, the long-term support levels are still in place so one needs to proceed with a degree of caution. In the near-term, some of the key supports to watch include 3325 and 3285, levels that were formerly support and resistance. Below these levels, the 50-day SMA comes in around 3265/70, followed by the 61.8% Fibonacci retracement at 3155.
On the upside, the short-term resistance level to watch is at 3390, a level which was previously support. The 200-day average comes in around 3480/5, followed by additional resistance, a 61.8% Fibonacci level and a bearish trend line all around 3500.
Source: FOREX.com. Please note this product is not available to US traders.
Look Ahead: Commodities
The past week was another very ugly week for commodities, with gold, oil and copper prices all dropping viciously at various stages during the week. We usually cover oil and gold almost every week here, but this time copper is actually catching our eyes. The metal is of course used in a wide range of products and industrial applications, which makes it a leading indicator for the health of the global economy. So it is not a good sign that its prices are falling. But should we really be worried? After all, there are several common denominators for the on-going weakness in commodity prices across the board. First and foremost it is the excessive supply of the commodities thanks in part to their past price gains which led to a boom in production. The resulting price declines should have been expected to happen at some stage down the line, although the magnitude of the falls is worrying nonetheless. Commodities are all priced in the US dollar and with the greenback looking strong and rising thanks to growing expectations of an imminent interest rate hike there, this is applying additional pressure.
But it is perhaps the weaker demand prospects due in part to a slowing Chinese economy and fears over the economic impact of a potential US interest rate hiking cycle on emerging economies that are unnerving investors the most. Recent macroeconomic pointers from China, including Wednesday’s factory output data which showed activity slowed to a seven-month low of 5.6% in October, continue to point to weaker demand growth for commodities from the world’s second largest economy. If this trend of weaker data continues then commodity prices could fall a lot further.
But there is only so far prices can fall of course, and with miners such as Glencore (L:GLEN) rushing to scale back production, the copper market should begin to tighten and price falls to at least slow down. However, Australian miners are still producing more and are ready to expand production. The weaker Australian dollar is obviously an advantage for miners Down Under, which has cushioned the impact of the drop in US dollar-denominated copper prices. They are gaining market share and it will thus be in their interest to keep extracting as much of the stuff as possible, in theory until such a time that marginal costs from additional units of production equal marginal revenues from those units sold. So much like the oil market situation, the glut is likely to remain in place in the near term and thus weigh on prices. But in the long term, the market should naturally tighten and prices recover.
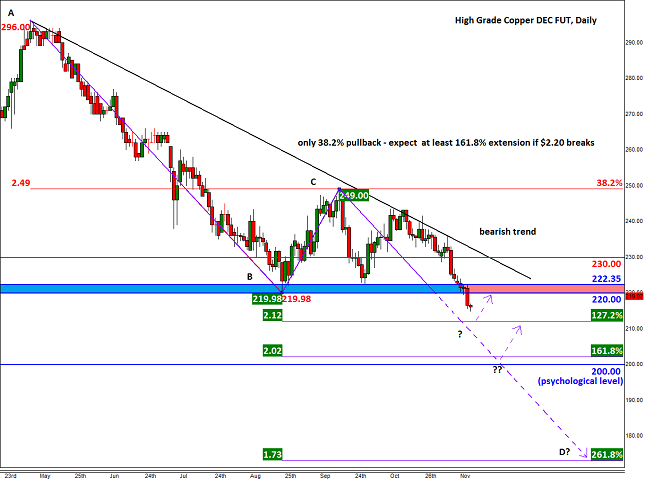
Indeed, the chart of the High Grade Copper future is painting a bleak picture for the metal’s near-term outlook. The last notable rally off the $2.20 handle saw price only manage to recover up to 38.2% of the previous downswing. This shallow retracement correctly suggested that further falls were on the way and now that the $2.20 level has broken down decisively, it points to continued weakness until proven wrong. As such, copper could go on to drop not just to the 127.2% Fibonacci extension level at $2.12, but potentially towards the 161.8 or even the 261.8 per cent extension levels over time, at $2.02 and $1.73 respectively. At this stage, a decisive closing break above $2.20-$2.22 area would be a bullish outcome in the short term and a break above the bearish trend would be bullish slightly longer term: unlikely scenarios as things stand.
Source: FOREX.com. Please note this product is not available to US clients
Global Data Highlights
Sunday, November 15
21:45 GMT – NZ Retail Sales (Q3)
The economic data kicked off early this week with New Zealand’s Q3 retail sales report scheduled for release 15 minutes before the forex markets officially opened. Retail sales in the island nation quietly rose for five consecutive quarters before the disappointing 0.1% q/q gain last quarter. Now, traders and economists were looking for a bounce back toward the 1.0% q/q level.
23:50 GMT – Japanese Preliminary GDP (Q3)
Keeping the theme of important quarterly releases rolling, Japan released its overall economic “growth” for Q3 early next week as well. Of course, growth is in quotation marks because the Japanese economy actually shrunk -0.4% q/q at the last release, and traders anticipated a -0.1% reading q/q this time around. The Bank of Japan has been adamant that it does not plan on expanding its QQE program any time soon, but if the economy falls into the unofficial definition of a recession (two straight quarters of declining GDP), the central bank may have to reconsider, with potentially negative consequences for the yen.
Monday, November 16
9:15 GMT – ECB President Draghi speaks
The head of the European central bank will deliver comments on two separate occasions this week, and traders will be eager to hear whether his views on the potential for further easing next month have changed, especially in the wake of the recent hawkish Fed rhetoric. We expect that Draghi will continue to pave the way for easier monetary policy next week, and the euro could dip as a result.
10:00 GMT – Eurozone Final CPI (Oct)
The developed world remains stuck in a low-inflation limbo, and the Eurozone is ground zero for stagnant prices. The Eurozone Consumer Price Index (CPI) has recovered from the negative m/m readings of early this year, but traders are anticipating prices will remain flat for the second straight month. If we see a surprise dip back into deflation, it would help cement the case for more ECB easing next week.
Tuesday, November 17
0:30 GMT – RBA Monetary Policy Meeting Minutes
These notes from the Reserve Bank of Australia meeting earlier this month will be closely monitored, as they’ll shed more light on the likely path of interest rates moving forward. Some economists have started to suggest that the RBA may start raising interest rates as soon as next year, while others still think more cuts are in order, so any signal of which way policymakers are leaning could lead to a big reaction in the Aussie.
9:00 GMT – UK CPI
Next week will be the “Week of the CPI Reports” for markets, and much like the Eurozone, inflation in the UK has been very subdued of late. Essentially since the start of the year, year-over-year prices have been unchanged and no change is expected, with traders anticipating a -0.1% reading this time around. A weaker-than-expected report could actually boost UK equities on the potential for continued low interest rates from the BOE.
13:30 GMT – US CPI (Oct)
The US inflation report has essentially the same implications as the ones in Europe: the Fed wants to see inflation ticking higher as a sign that the economy is strong enough to support a rate increase (especially after the disappointing PPI report noted above). Anything above 0.2% would be supportive of a rate hike and could nudge the US dollar higher.
Wednesday, November 18
19:00 GMT – Federal Reserve Monetary Policy Meeting Minutes
The most widely-watched US economic release this week may be the minutes from the October FOMC meeting. While no one was anticipating that the Fed would move at that meeting, the hawkish statement surprised many traders. The minutes will allow traders insight into the likelihood of a December rate hike, with obvious implications for the US dollar.
Thursday, November 19
TBD – BOJ Monetary Policy Statement and Press Conference
The Bank of Japan refrained from increasing stimulus at its big late October meeting, when it also released updated economic forecasts. With only three weeks passing since that key meeting, we’re unlikely to see any big changes to monetary policy meeting this time around, or indeed for the rest of the year.
9:30 GMT – UK Retail Sales (Oct)
The UK consumer will try to best the disappointing performance of its former colony across the Atlantic, but expectations are low. On Friday afternoon, traders and economists were actually anticipating a -0.4% decline in October retail sales as UK consumers keep a tight hold on their pocketbooks and wait for big “Black Friday” discounts.
Friday, November 20
7:00 GMT – ECB President Mario Draghi speech
The head of the European central bank will deliver comments on two separate occasions this week, and traders will be eager to hear whether his views on the potential for further easing next month have changed, especially in the wake of the recent hawkish Fed rhetoric. We expect that Draghi will continue to pave the way for easier monetary policy this week, and the euro could dip as a result.
