Signals are automatically generated by integrating electronic weekly statistics with proprietary algorithms.
GOLD
WEEKLY MOVING AVERAGES
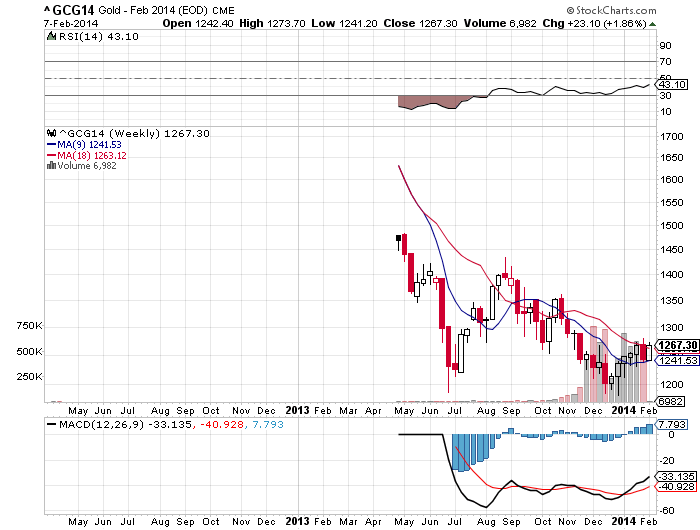
The February gold futures contract closed at 1267 . The market closing above the 9 MA (1242) is confirmation that the trend momentum is bullish. A close below the 9 MA would negate the weekly bullish short-term trend to neutral.
VC CODE WEEKLY MOMENTUM INDICATOR
With the market closing above The VC Weekly Price Momentum Indicator of 1261, it confirms that the price momentum is bullish. A close below the VC Weekly, would negate the bullish signal to neutral.
VC CODE WEEKLY PRICE INDICATOR
Cover short on corrections at the 1247 to 1228 levels and go long on a weekly reversal stop. If long, use the 1228 level as a Stop Close Only and Good Till Cancelled order. Look to take some profits on longs, as we reach the 1280 to 1294 levels during the week.
SILVER
WEEKLY MOVING AVERAGES
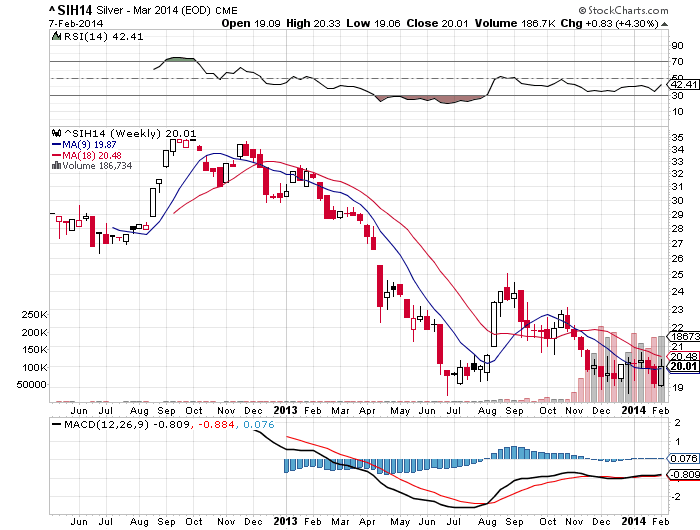
The March Silver futures contract closed at 20.01. The market closing above the 9 day MA (19.87) is confirmation that the trend momentum is bullish. A close below the 9 MA would negate the weekly bullish short-term trend to neutral.
VC CODE WEEKLY MOMENTUM INDICATOR
With the market closing above The VC Weekly Price Momentum Indicator of 19.80, it confirms that the price momentum is bullish. A close below the VC Weekly, it would negate the bullish signal to neutral.
VC CODE WEEKLY PRICE INDICATOR
Cover short on corrections at the 19.27 to 18.53 levels and go long on a weekly reversal stop. If long, use the 18.53 level as a Stop Close Only and Good Till Cancelled order. Look to take some profits on longs, as we reach the 20.54 to 21.07 levels during the week.
EURO
WEEKLY MOVING AVERAGES
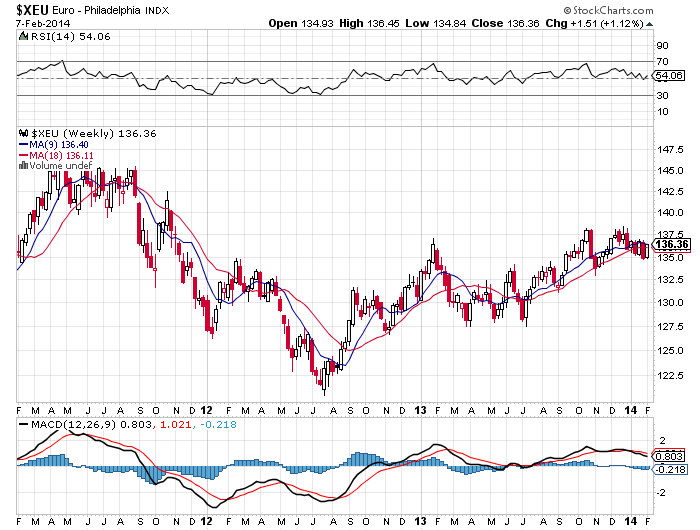
The Euro PA Index contract closed at 136.36. The market closing below the 9 day MA (136.40) is confirmation that the trend momentum is bearish. A close above the 9 MA would negate the weekly bearish short-term trend to neutral.
VC CODE WEEKLY MOMENTUM INDICATOR
With the market closing above The VC Weekly Price Momentum Indicator of 135.88, it confirms that the price momentum is bullish. A close below the VC Weekly, it would negate the bullish signal to neutral.
VC CODE WEEKLY PRICE INDICATOR
Cover short on corrections at the 135.32 to 134.27 levels and go long on a weekly reversal stop. If long, use the 134.27 level as a Stop Close Only and Good Till Cancelled order. Look to take some profits on longs, as we reach the 135.32 and 134.27 levels during the week.
E MINI S&P 500
WEEKLY MOVING AVERAGES
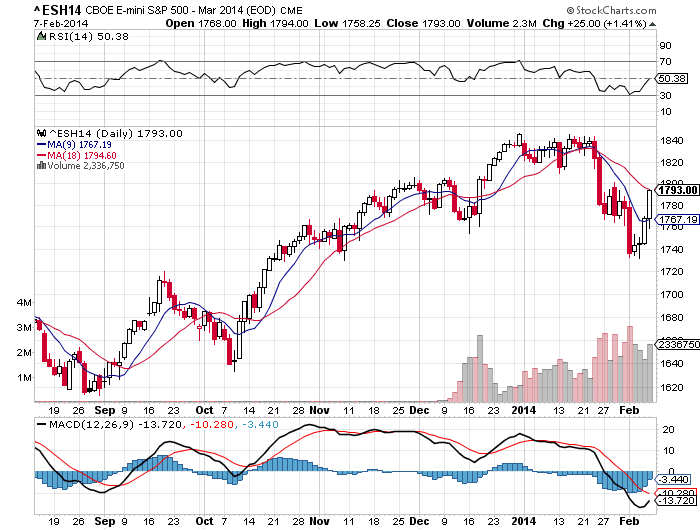
The March E Mini futures contract closed at 1.793. The market closing above the 9 day MA (1.767) is confirmation that the trend momentum is bullish. A close below the 9 MA would negate the weekly bullish short-term trend to neutral.
VC CODE WEEKLY MOMENTUM PRICE INDICATOR
With the market closing above The VC Weekly Price Momentum Indicator of 1.782, it confirms that the price momentum is bullish. A close below the VC Weekly, it would negate the bullish signal to neutral.
VC CODE WEEKLY PRICE INDICATOR
Cover short on corrections at the 1.769 to 1.746 levels and go long on a weekly reversal stop. If long, use the 1.746 level as a Stop Close Only and Good Till Cancelled order. Look to take some profits on longs, as we reach the 1.805 to 1.818 levels during the week.
CRUDE OIL
WEEKLY MOVING AVERAGES
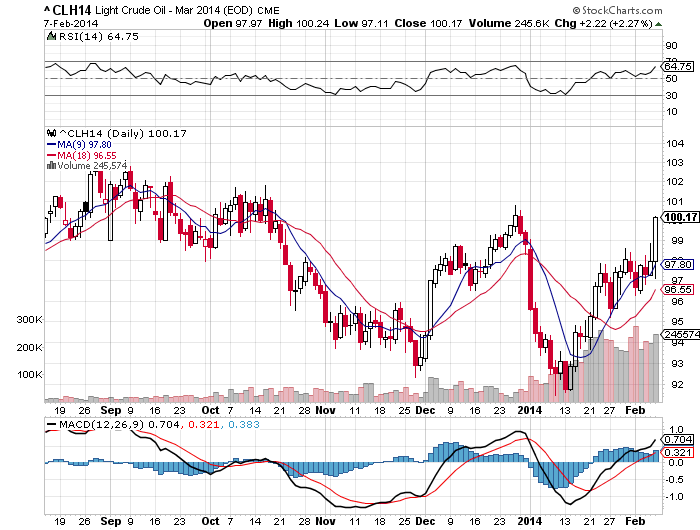
The March Crude Oil contract closed at 100.17. The market closing above the 9 MA (97.80) is confirmation that the trend momentum is bullish. A close below the 9 MA would negate the weekly bullish trend to neutral.
VC CODE WEEKLY MOMENTUM INDICATOR
With the market closing above The VC Weekly Price Momentum Indicator of 99.17, it confirms that the price momentum is bullish. A close below the VC Weekly, it would negate the bullish signal to neutral.
VC CODE WEEKLY PRICE INDICATOR
Cover shorts on corrections at the 98.11 to 96.04 levels and go long on a weekly reversal stop. If long, use the 96.04 level as a Stop Close Only and Good Till Cancelled order. Look to take some profits, if long, as we reach the 98.11 and 96.04 levels during the week.
The information in the Market Commentaries was obtained from sources believed to be reliable, but we do not guarantee its accuracy. Neither the information nor any opinion expressed therein constitutes a solicitation of the purchase or sale of any futures or options contracts.
Disclosure: Trading Derivatives, Financial Instruments And Precious Metals Involves Significant Risk Of Loss And Is Not Suitable For Everyone. Past Performance Is Not Necessarily Indicative Of Future Results.

