Preface: Explaining our market timing models
We maintain several market timing models, each with differing time horizons. The "Ultimate Market Timing Model" is a long-term market timing model based on the research outlined in our post, Building the ultimate market timing model. This model tends to generate only a handful of signals each decade.
The Trend Model is an asset allocation model which applies trend following principles based on the inputs of global stock and commodity price. This model has a shorter time horizon and tends to turn over about 4-6 times a year. In essence, it seeks to answer the question, "Is the trend in the global economy expansion (bullish) or contraction (bearish)?"
My inner trader uses the trading component of the Trend Model to look for changes in direction of the main Trend Model signal. A bullish Trend Model signal that gets less bullish is a trading "sell" signal. Conversely, a bearish Trend Model signal that gets less bearish is a trading "buy" signal.
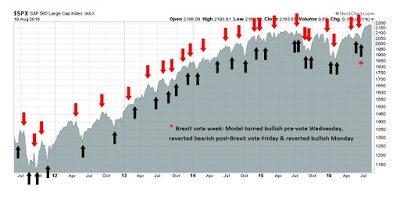
The history of actual out-of-sample (not backtested) signals of the trading model are shown by the arrows in the chart below. Past trading of the trading model has shown turnover rates of about 200% per month.
The latest signals of each model are as follows:
- Ultimate market timing model: Buy equities*
- Trend Model signal: Risk-on*
- Trading model: Bullish*
A 2017 market top?
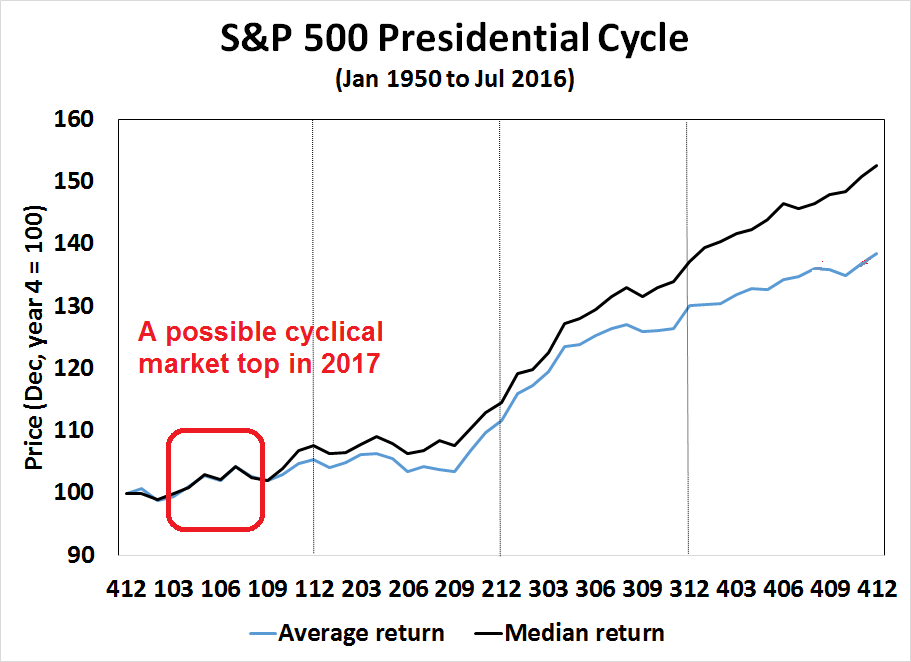
I don't want anyone to get the idea that I am a permabull. I have been steadfastly bullish on stocks for all of 2016. This may be the time to sound a cautionary note by outlining a scenario of how stock prices could make a cyclical top next year.
The chart below shows how the stock market behaves during the four-year presidential cycle. The black line shows the pattern based on past monthly median returns and the blue line shows the pattern based on average monthly returns. Statistically, median returns (black line) are better representations than average returns (blue line) because averages can be distorted by large outliers, such as the Crash of 2008.

The stars may be aligning for a replay of the presidential cycle, where stock prices rise into next year and possibly top out next summer. In this week's post, I will discuss:
- The bullish tailwinds prevailing for stocks today
- The timing of a possible cyclical peak
- The bearish headwinds that could lead to the formation of the market peak.
Disclaimer: Cam Hui is a portfolio manager at Qwest Investment Fund Management Ltd. (""Qwest""). This article is prepared by Mr. Hui as an outside business activity. As such, Qwest does not review or approve materials presented herein. The opinions and any recommendations expressed in this blog are those of the author and do not reflect the opinions or recommendations of Qwest.
None of the information or opinions expressed in this blog constitutes a solicitation for the purchase or sale of any security or other instrument. Nothing in this article constitutes investment advice and any recommendations that June be contained herein have not been based upon a consideration of the investment objectives, financial situation or particular needs of any specific recipient. Any purchase or sale activity in any securities or other instrument should be based upon your own analysis and conclusions. Past performance is not indicative of future results. Either Qwest or Mr. Hui June hold or control long or short positions in the securities or instruments mentioned.

