Now that the excitement over the FOMC decision is out of the way, I wanted to write about a pet peeve of mine - the analysis of EPS estimates and their expectations. Here are some of the analytical errors that I am seeing:
Expected EPS vs. reported EPS
The WSJ warned that "The U.S. Appears Headed for an Earnings Recession", noting:
The second-quarter earnings season ended Friday with the SP 500’s profits contracting for the first time since the third quarter of 2012, according to FactSet. With expectations of a 4.4% decline in third-quarter earnings, the large-cap S&P index is poised for its first earnings recession in six years.A recession, in most forms, is classified as two straight quarters of negative growth. While that hasn’t happened for earnings since the financial crisis, low oil prices, an elevated U.S. dollar and sluggish global growth have all weighed on profits this year. Not even a flurry of buybacks was enough to push profits into positive territory in the second quarter.
Falling corporate earnings are descending upon markets as volatility has ramped up amid concerns about growth overseas, namely in China. Perhaps more problematic, negative profit growth also comes as the Federal Reserve prepares to slowly remove its proverbial punch bowl from the mix, leading to less support from two previous sources of strength during the current bull market.
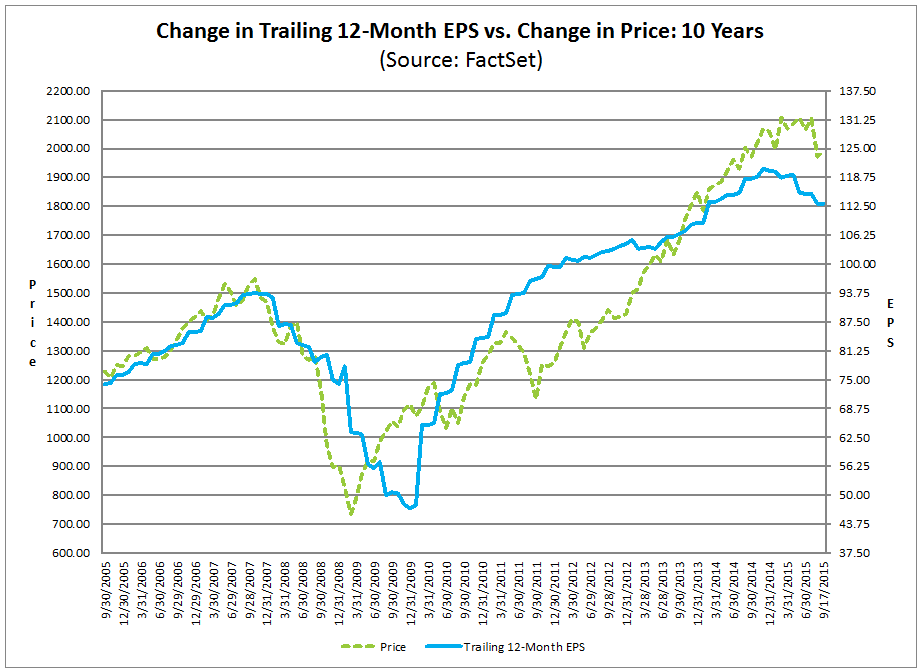
We all know that the stock market is inherently forward looking. This chart from John Butters of Factset shows the relationship between trailing 12 month EPS and stock prices. Stock prices have led trailing EPS, not the other way around. So why should the market be concerned about an earnings recession in Q3 that's old news?
Analyzing the "right" EPS expectations
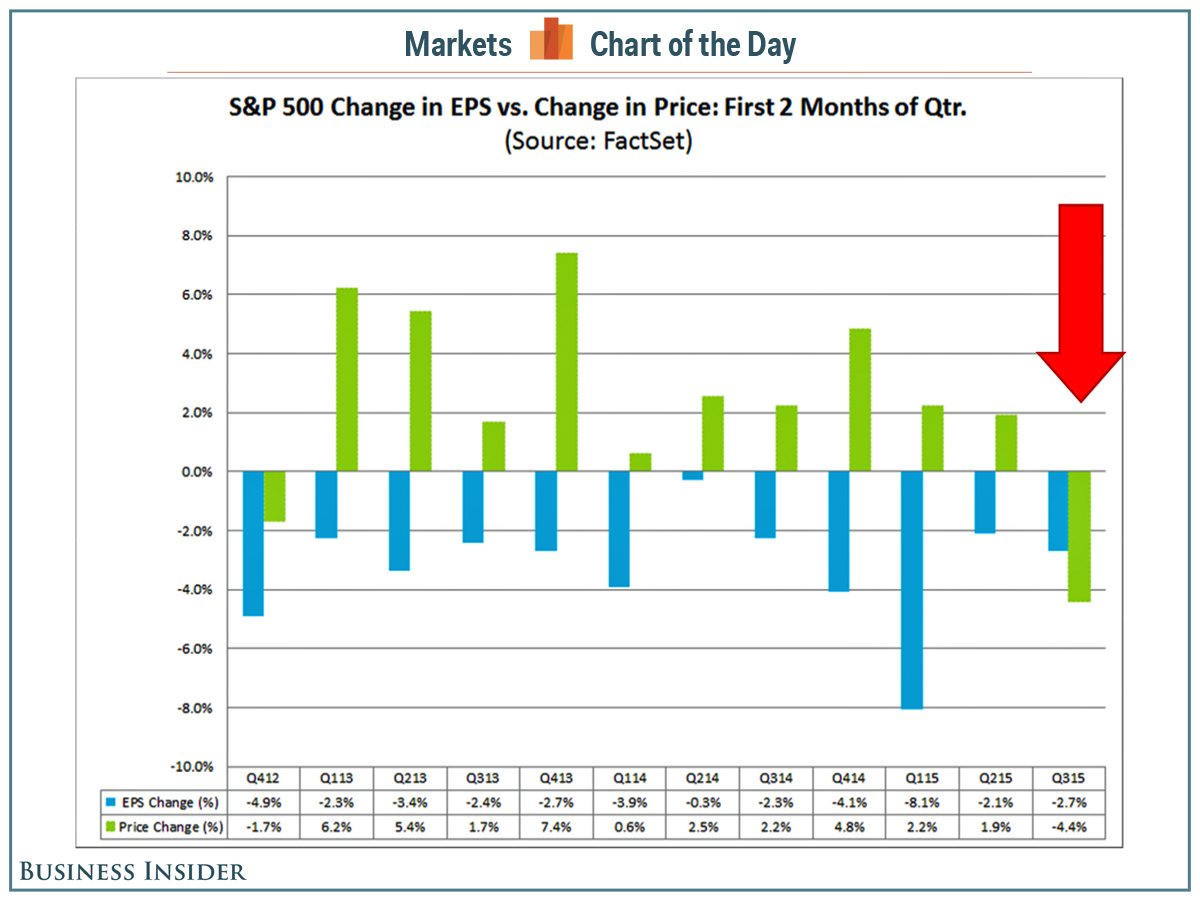
In another example, Sam Ro at Business Insider recently featured a story about how "the stock market is finally making sense" by highlighting the relationship between stock prices (green bars) and quarterly EPS estimate revisions (blue bars).
Ro was puzzled about the past disconnect between how past negative EPS revisions did not lead to price declines, but noted that in the long run, stock prices are driven by EPS expectations:
But lately, the stock market has started to make intuitive sense again as we witnessed prices fall along with earnings estimates....In the long run, the relationship between stock prices and earnings seem to revert to long-term averages. This is good news for patient investors who are willing and able to ride out short-term swings in the market as they wait for value to come into fruition.
But in the short run, you're taking a big gamble trading on the assumption that these things work themselves out in a timely manner.
Estimates have always fallen
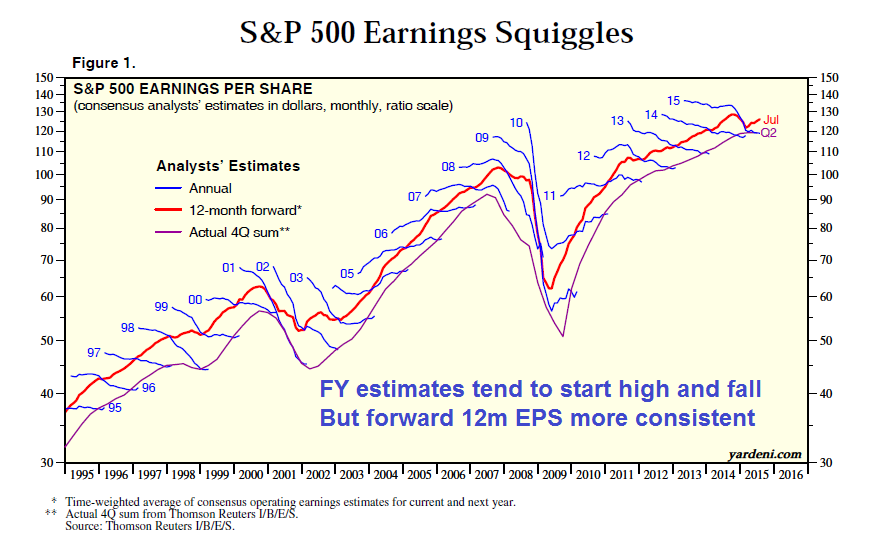
The "rookie" mistake that Sam Ro made is that he didn't realize that EPS estimates tend to start high and fall over time. This chart from Ed Yardeni shows the past patterns of EPS estimates for any single fiscal year (blue squiggles) since 1995. EPS estimates for any single period, whether it's a fiscal year or fiscal quarter, start high and have a tendency to fall. It is therefore not unusual at all to see estimate revisions stay negative for any single FY or FQ.
Normalize with forward EPS
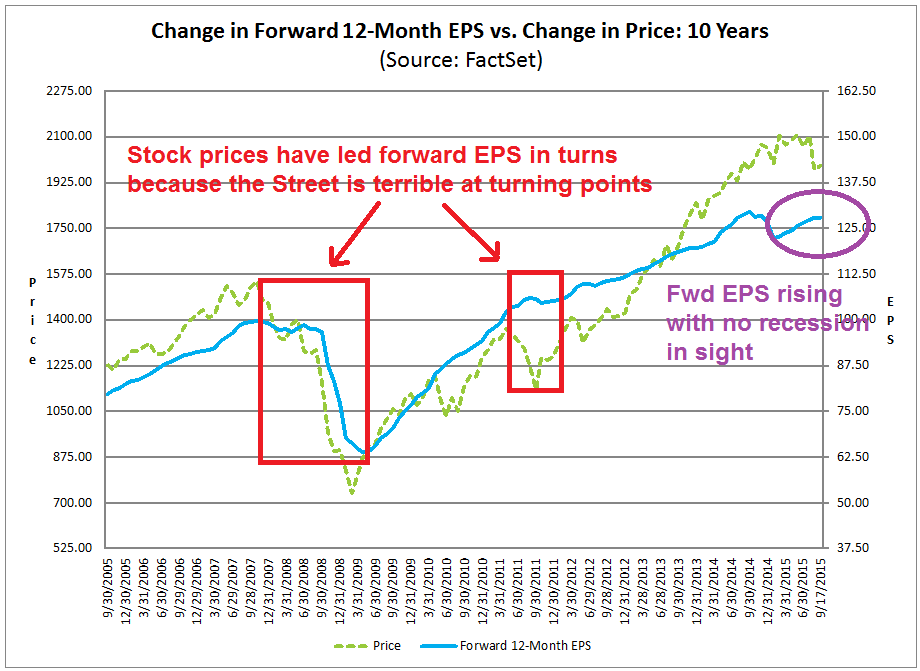
To address the issues of falling EPS estimates while remaining forward looking, I believe that the best way is to normalize with a rolling window of forward 12 month EPS estimates. Compare this chart, also from John Butters of Factset, with the previous trailing 12 month EPS chart and you can see the difference. The forward 12 month EPS estimates are far more correlated with stock prices than the trailing 12 month EPS, largely because it is forward looking. Moreover, it does not suffer from the problems of continual estimate downgrades with time.
To be sure, there are still problems with this technique. The Street is terrible at turning points and analysts has never correctly been able to forecast an economic downturn. That`s why I also supplement forward 12 month EPS analysis with macro analysis from the likes of New Deal democrat (last weekly update here) and the array of macro forecasters monitored by Jeff Miller (last update here).
While there is some softness in selected economic data points, there are no signs of a recession in the next 6-12 months. With forward EPS estimates still rising, my inner investor is therefore constructive on stocks and he remains in "buy weakness" mode.
Disclosure: Cam Hui is a portfolio manager at Qwest Investment Fund Management Ltd. ("Qwest"). This article is prepared by Mr. Hui as an outside business activity. As such, Qwest does not review or approve materials presented herein. The opinions and any recommendations expressed in this blog are those of the author and do not reflect the opinions or recommendations of Qwest.
None of the information or opinions expressed in this blog constitutes a solicitation for the purchase or sale of any security or other instrument. Nothing in this article constitutes investment advice and any recommendations that may be contained herein have not been based upon a consideration of the investment objectives, financial situation or particular needs of any specific recipient. Any purchase or sale activity in any securities or other instrument should be based upon your own analysis and conclusions. Past performance is not indicative of future results. Either Qwest or Mr. Hui may hold or control long or short positions in the securities or instruments mentioned.


