A year end series taking a longer perspective in many market indexes, macro-related commodities, currency and bonds. Over the next three weeks these reviews are intended to help create a high level road map for the the next twelve months and beyond.
We continue with the Philadelphia Semiconductor Index.
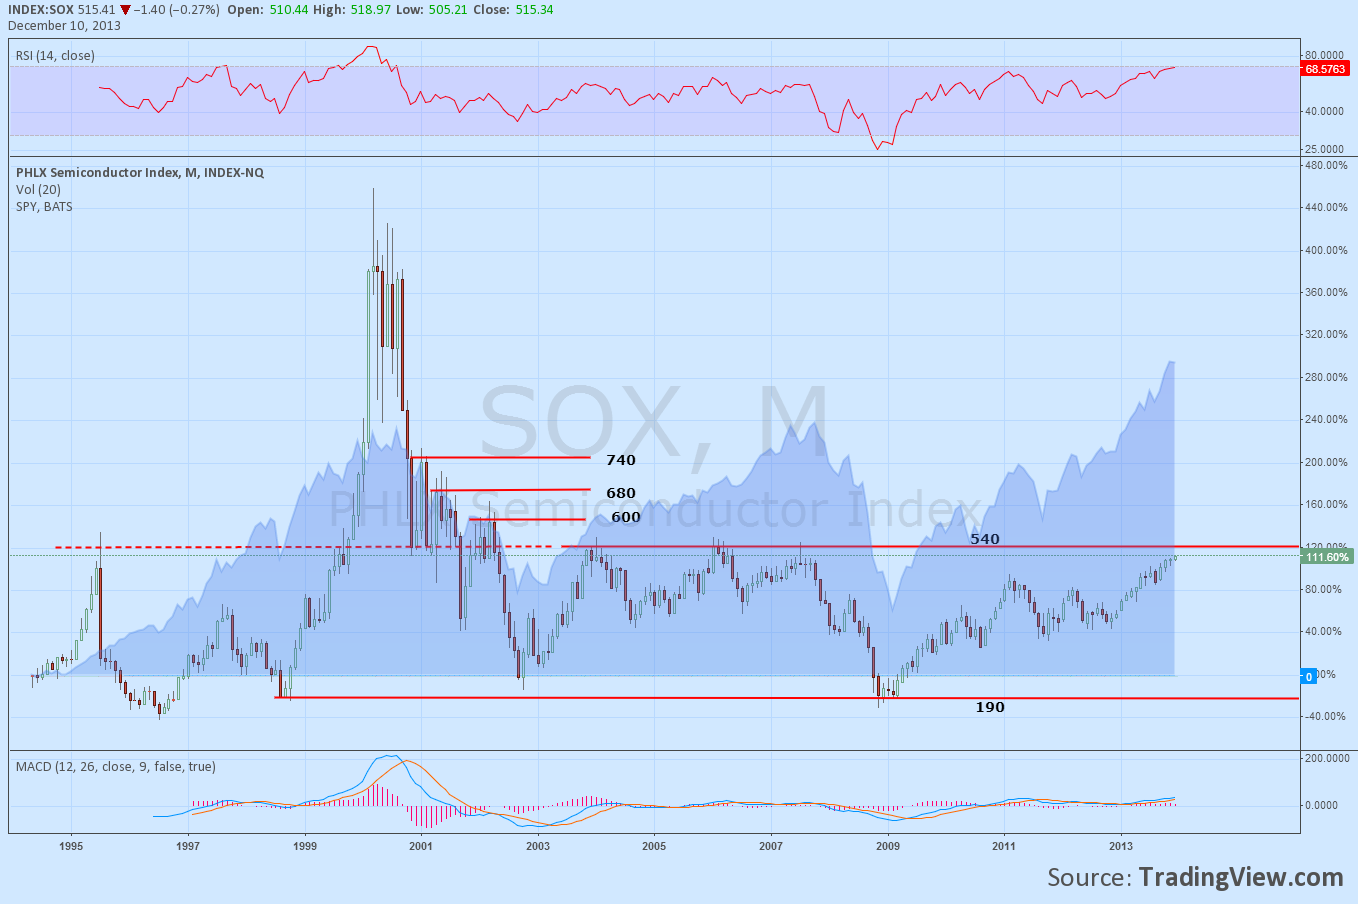
The Philadelphia Semiconductor Index, SOX, has not been around for 20 years yet but has gained importance as a predictor of the S&P 500. A look at the monthly chart shows why. There is a recognizable correlation that extends back for nearly the life of the index. Focusing on the index itself shows that broadly it has been in a range between 190 and 540 for nearly its entire life. A broad range, but also a long consolidation. The only real exception is the period around the Tech bubble in 2000. This is the first take away. Tech prices are no where near as frothy as they were in 2000. Currently the index is approaching the top of the channel with the momentum indicators, the Relative Strength Index (RSI) and the MACD both moving higher. These are supportive of more upside. If it does break to the upside then has 3 levels of resistance before it gets crazy frothy, 600, 680 and 740. Above that and there is a lot of room technically to run higher. Can it get above that 540 level? That is the key.
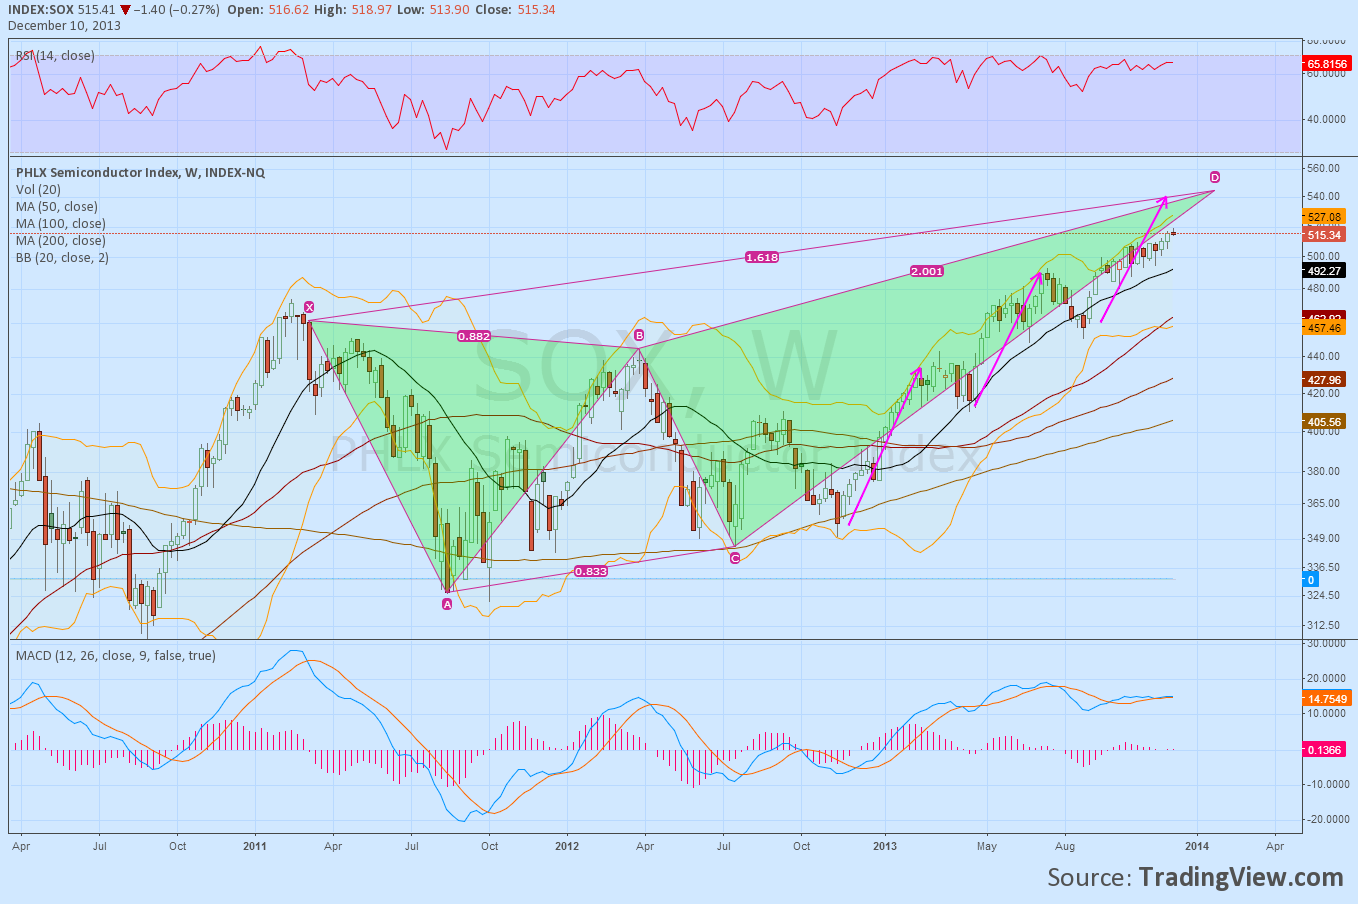
The weekly picture shows that the SOX is tracing out a bearish Deep Crab Harmonic since April 2012. The good news is that it still has room to run higher to the Potential Reversal Zone (PRZ) at 544, but the bad news is that is not far enough out of the range from the monthly chart to gather longer term momentum and also not very far from where it is now. Looking at the Measured Moves higher also shows a target in the 530 to 535 range. Harmonics are not a definitive stop level but they nor the Measured Move are the fuel to move this index over that critical 540 level. In the good news column the trend is higher and does not show signs of stalling with the RSI holding in bullish territory and the MACD level. All of the Simple Moving Averages are below the index and they are rising. There are no signals to sell at these levels. Perhaps the daily view can help?
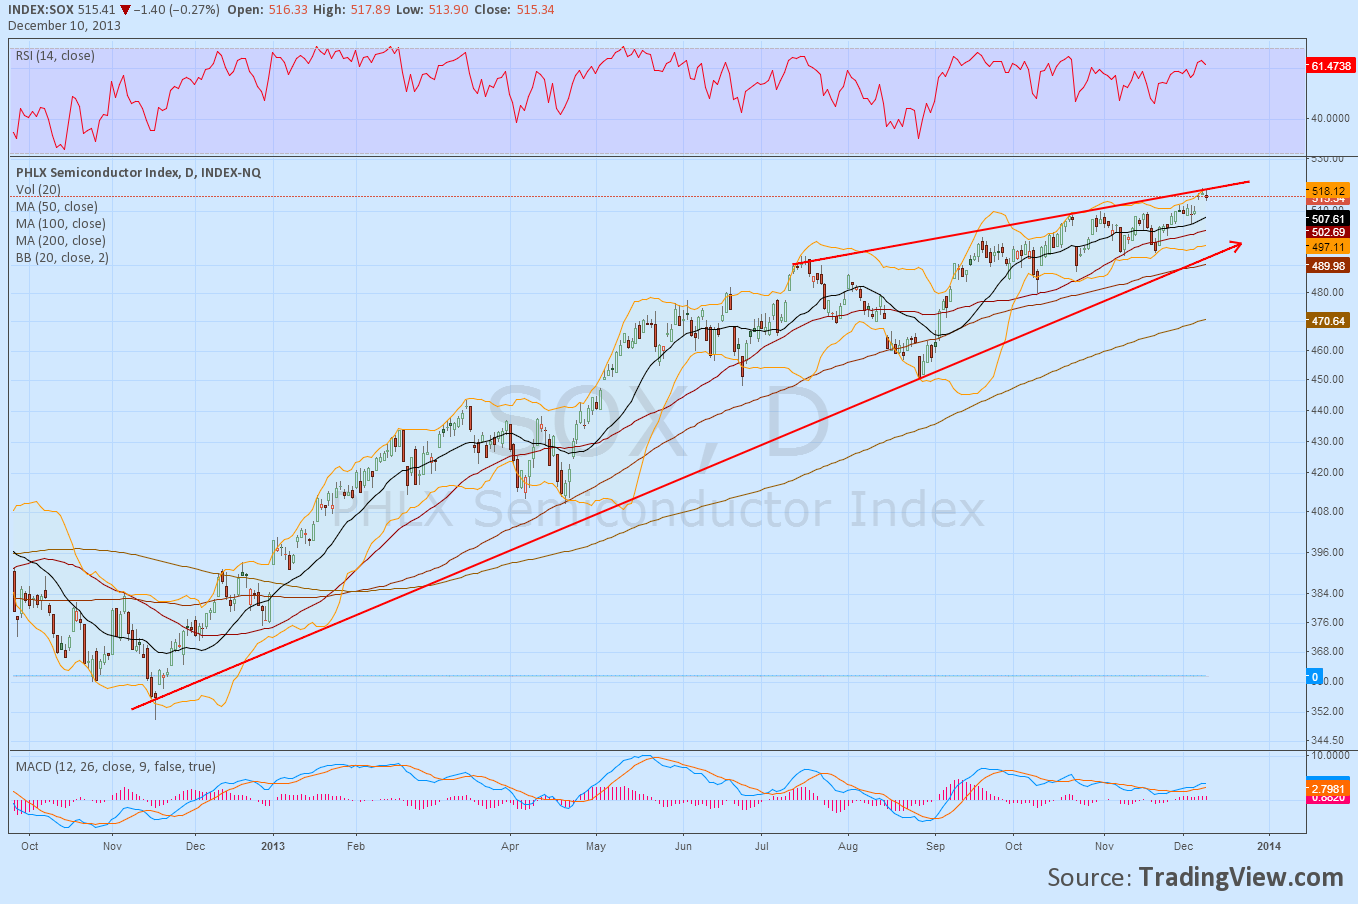
And that sentiment of a rising trend with no sell signal is echoed in the daily chart. The trend on this timeframe has been higher since November 2012, and although the rising trend resistance is creating a rising wedge with the longer term rising support there is no risk to the trend here. There is a risk of a pullback from the top of the wedge, but until it breaks the bottom support currently near 500 the trend remains higher.
The SOX continues to rise with a major hurdle at 540. That does not mean to sell tech stocks at 540, but rather that you can still own them now and up until 540 on the Index. You can get more conservative with your stops and add protection as the index gets to 540, but there is no reason to sell unless it fails there. Technical Analysis is about points of reflection more than points of inflection, and 540 is one of those points. Let the index tell you it intends to deal with that level before you take any action.
The information in this blog post represents my own opinions and does not contain a recommendation for any particular security or investment. I or my affiliates may hold positions or other interests in securities mentioned in the Blog, please see my Disclaimer page for my full disclaimer.
Original post
