Get 40% Off
🤯 Perficient is up a mind-blowing 53%. Our ProPicks AI saw the buying opportunity in March.Read full update

The Only Equity Charts You Need

Published 03/27/2015, 01:11 PM
Updated 07/09/2023, 06:31 AM

US equities came under heavy pressure this week after the small-cap Russell 2000 posted yet another all-time high last week. There are more than a few signs that all is not well for equities, however, the situation is not yet dire:

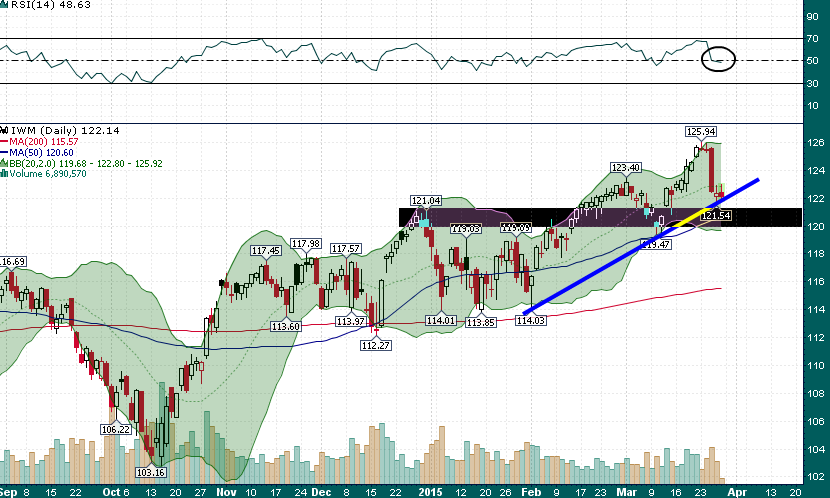
The recent uptrend in iShares Russell 2000 Index(ARCA:IWM) is currently being tested and there is a very important area of confluence just below the 120.00-121.00 area:

 iShares Russell 2000: Uptrend Test

In addition, the daily RSI(14) just moved below the median line (an area at which it recently found support).

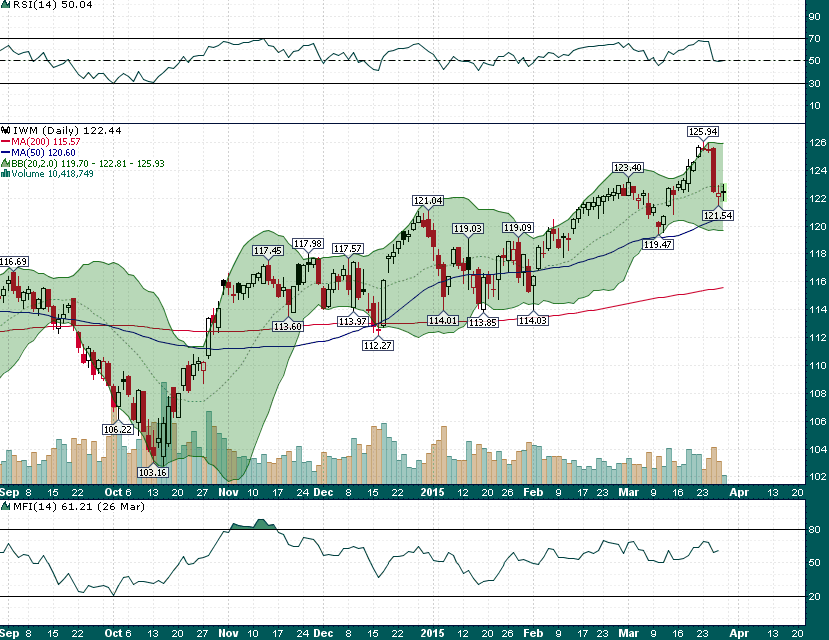
Also notice that the daily RSI(14) did not even reach ‘overbought’ territory above 70 at the recent all-time highs nor has the money-flow index (MFI-14) reached overbought levels since the October-November rally. That's an indication of a weak rally with relatively narrow participation -- the sort of move that can be quickly reversed.

 iShares Russell 2000: Weak Rally

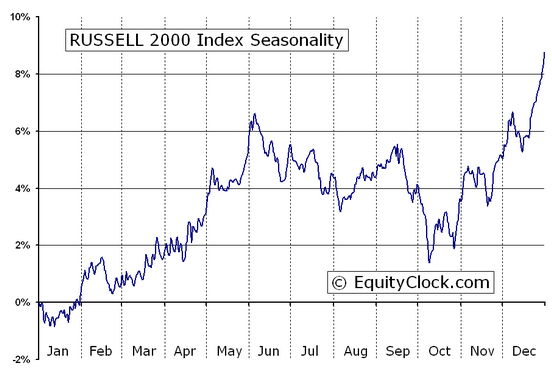
We are in a seasonally soft period for the next couple of weeks before small caps move into one of the most bullish periods of the calendar year:

Russell 2000 Seasonality

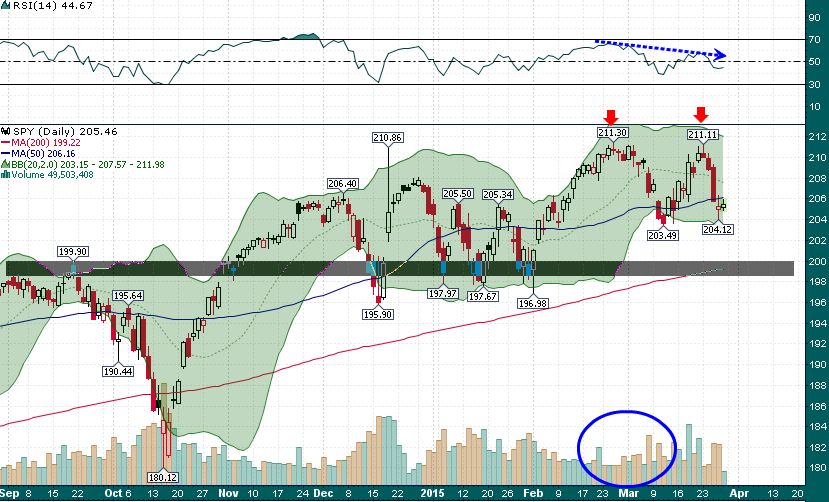
Meanwhile, the (ARCA:SPY) has formed a double top with the same momentum and volume divergences as we saw in the Russell 2000:

SPDR S&P 500 Double Top

The all-time high of 2119.59 posted in the S&P 500 during February was made on extraordinarily light volume. A test down to the 200 area on SPY (roughly 2000 on the SPX), which coincides with the rising 200-day simple moving average, seems quite likely in the coming days. With month end/quarterly rebalancing set to unfold Monday and Tuesday -- in addition to the aforementioned technical dynamic -- next week is shaping up to be a crucial one.

3rd party Ad. Not an offer or recommendation by Investing.com. See disclosure here or remove ads .

Via Energy and Gold.com

Latest comments

Risk Disclosure: Trading in financial instruments and/or cryptocurrencies involves high risks including the risk of losing some, or all, of your investment amount, and may not be suitable for all investors. Prices of cryptocurrencies are extremely volatile and may be affected by external factors such as financial, regulatory or political events. Trading on margin increases the financial risks.
Before deciding to trade in financial instrument or cryptocurrencies you should be fully informed of the risks and costs associated with trading the financial markets, carefully consider your investment objectives, level of experience, and risk appetite, and seek professional advice where needed.
Fusion Media would like to remind you that the data contained in this website is not necessarily real-time nor accurate. The data and prices on the website are not necessarily provided by any market or exchange, but may be provided by market makers, and so prices may not be accurate and may differ from the actual price at any given market, meaning prices are indicative and not appropriate for trading purposes. Fusion Media and any provider of the data contained in this website will not accept liability for any loss or damage as a result of your trading, or your reliance on the information contained within this website.
It is prohibited to use, store, reproduce, display, modify, transmit or distribute the data contained in this website without the explicit prior written permission of Fusion Media and/or the data provider. All intellectual property rights are reserved by the providers and/or the exchange providing the data contained in this website.
Fusion Media may be compensated by the advertisers that appear on the website, based on your interaction with the advertisements or advertisers.
© 2007-2024 - Fusion Media Limited. All Rights Reserved.