If one types the exact-match phrase +"dollar strength" into an Internet search engine of choice, results returned are on the order of one-half million links. That's a lot of links, especially when compared to instead typing in +"gold strength" which garners just 39k links. So much for Gold being the hot item in the popularity contest, (and on this wet, chilly San Francisco morning, a serving of hot links would be, cholesterol aside, heartily welcome).
Yet contrary to popular opinion -- and you regular readers out there know our stance on this -- so-called "dollar strength" is hardly the death-knell for Gold, our on occasion having pointed to the simultaneous trading strength in both markets during 2010. But to open this week's missive, let's really tear the cover off the myth of Gold and the Dollar as having to be negatively correlated.
Therefore with the "muscled-up" buff Buck standing atop the currency podium these days, 'tis time to put into perspective the pop FinCulture deference to "dollar strength". Below, we've updated the Dollar Index chart first posted in our 13 September missive, the level then being 84.305, and now having settled yesterday (Friday) at 85.800:
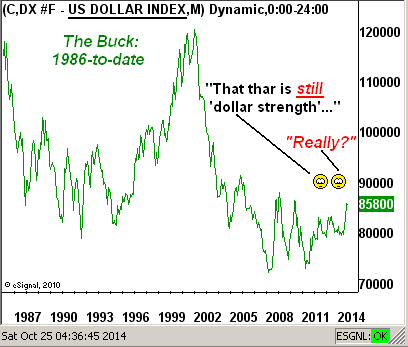
"But it definitely has been going up, mmb..."
We can all see that, Squire, but the point is: relative to the Federal Reserve Bank having increased the supply of M2 from $5.43 trillion (per the Dollar Index's last material peak back in January 2002) by $6.07 trillion (or +112%) to a total today of $11.50 trillion, Gold tonnage over the same 12 years has increased by a mere 22%, in turn denoting any confidence in "dollar strength" as comical. (Moreover, if you're really scoring at home, since October 1980 -- which is a heckuva long time to have been so doing -- Gold tonnage has increased just +90% whilst M2 has soared +622%). And in so scoring, you may recall our mid-summer math that already puts the price above $2,000/oz. Too bad nobody wants real money.
Whereas Gold is a concrete monetary asset of limited supply, the Dollar is an abstract, albeit accepted, asset of essentially infinite supply as is considered necessary, which in turn is weighed via its Index against six other abstract fiat figments: Canada's Dollar, the EuroZone's Euro, Japan's Yen, the UK's Pound Sterling, Sweden's Krona and Switzerland's Franc, (the latter becoming "softly-pegged" to the Euro in 2011, after having only been fully off the Gold standard since 2000). But abstract is nonetheless abstract, and when weighing the abstractiveness of any one foundationless faux dough against the abstractiveness of any of the others, especially as some of their supplies multiply like rabbits, 'tis a bit like doing a juggling act with air as the objects: there's really nothing there. 'Tis why we oft say that, at the end of the day, Gold plays no currency favourites, which at times includes even the Dollar.
Here we've the proof with Gold alongside the Dollar Index:
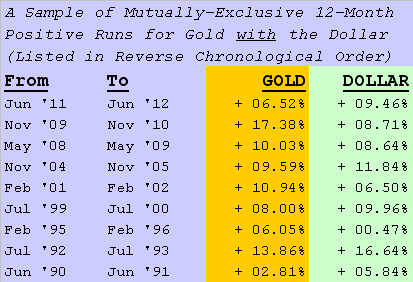
In fact, for the 336 months over which the above sampling was taken, since November 1985 in looking out one full year from each month, Gold and the Dollar both rose in 69 (or 21%) of those year-over-year cases. Yes, the majority of the time the correlation is negative, but hardly exclusively so, and as you can see in the above table, there are some pretty sturdy simultaneous increases in both. So as we've remarked in the past, be it the Dollar or the Euro or the Yen or whatever the currency flavour in favour is, when it comes to dog currencies, 'tis just one bow-wow fiat being valued against another. (Granted: Switzerland's St. Bernard does maintain quite the imposing rate of exchange at a hefty "buck six" for one li'l ole Franc, considering they used to cost 25¢).
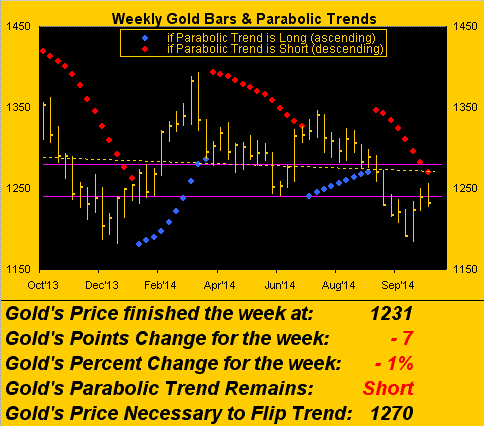
Nonetheless, in the wee hours here one morning this past week I did catch on Bloomy Radio BNP Paribas' Harry Tchilinguirian, (he heads their commodity markets strategy), who directly put forth that the lack of interest in Gold is due to "dollar strength". That having being said, the Dollar Index has come off just a bit over the last few weeks, which effectively or otherwise has brought resiliency back into Gold as we go to its weekly bars and parabolic trends. And as suggested in our most recent reports, the meeting within the purple lines of price and descending red trend dots appears to be on track. So as we close out the month of October this week, should Gold not first eclipse the noted 1270 flip price, the next red dot shall be in the 1250s, Gold having already traded up in that area this past week despite then slumping somewhat in the joyous recovery of the stock market:
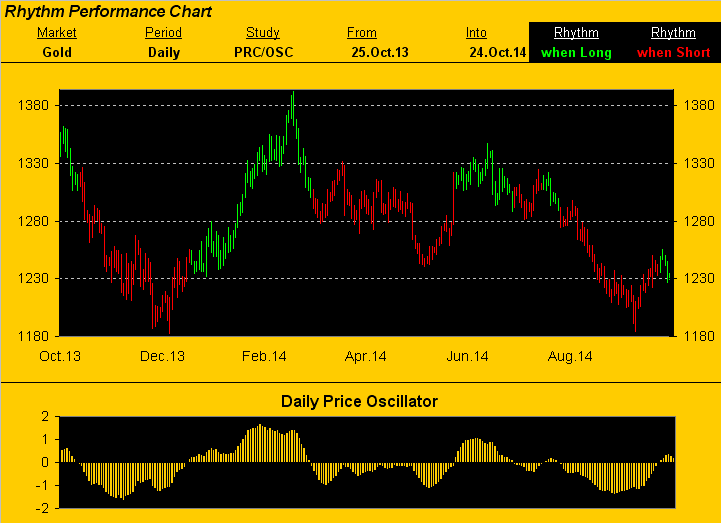
Now to update Gold's daily Price Oscillator which as portrayed a week ago had just turned positive. Here's the current stance of that study, that as we'd last noted has seen price actually struggle in some prior occasions upon turning "green" rather than regularly following-though to the upside. Of note: the 6-hr. version of this same study turned negative during the past week, suggesting a short-term Market Rhythm target of 1216.1; just something of which to be aware within this broader, positive daily version, (barring the bars becoming "red"):
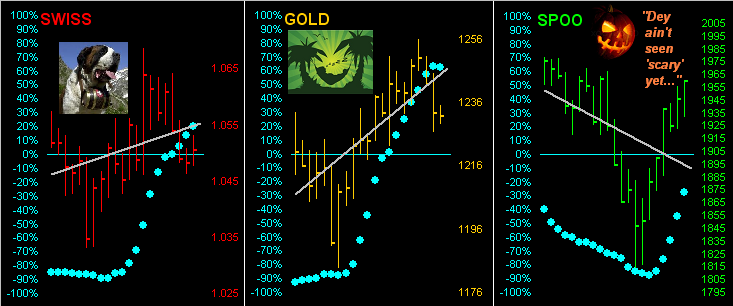
Next let's turn to this triumvirate of 21-day linear regression trends. Having spoken of "dollar strength" waning at least a little of late, 'tis reflected in the left-hand panel of the Swiss Franc's daily bars, their diagonal trend line positively pitched and the baby blue dots on the rise adding to the consistency of the trend. In the center panel we've the last 21 days for the yellow metal, which of the eight markets that comprise BEGOS (Bond / Euro & Swiss / Gold, Silver & Copper / Oil / S&P) is sporting the steepest upside trendline of the bunch, although as you can see, Gold's Baby Blues just kinked to the downside yesterday. Then in the right-hand panel there's the S&P 500 which has yet to complete even a full 10% correction: put that in yer pumpkin pie ... yikes:
Speaking of consistency, where does it seem to be most lacking? Try incoming economic data: whilst fairly light this past week, 'twas all over the map. Existing Home Sales rose but those for new ones were revised notably lower. Leading Economic Indicators rose but so did Initial Jobless Claims. Then this coming Wednesday our Federal Open Market Committee shall issue a policy statement, but Head Teller Old Yeller conveniently shan't then be holding a press conference in spite of the final dregs of Quantitative Easing swirling down the drain. Meanwhile across-the-pond, just as things suddenly are on the upswing with EuroZone businesses performing much better than forecasters expected -- why even Spain's rate of unemployment fell to its lowest level since the end of 2011, their economy turning into one of the fastest-growing in the Zone -- the European Central Bank is back on the bond buying binge, hoovering up one billion dollars worth (€800m) last week alone. In cinématique terms, might we dub this "The Return of the Euro Yo-Yo"? And you know the general outcome of film sequels: bad. For Gold, of course, (again playing no currency favourites), this ultimately is good.
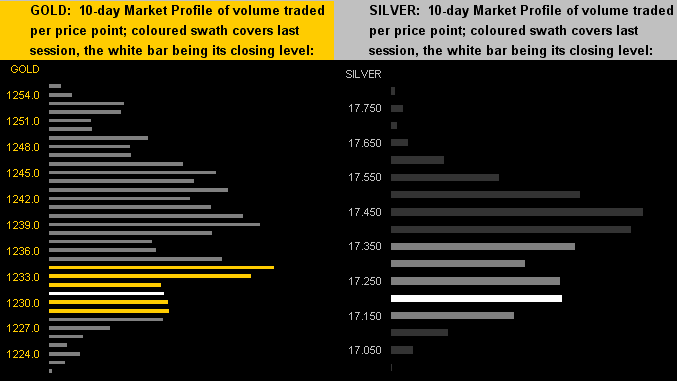
Let's wrap it up analytically with these precious metal Market Profiles, followed by a few anecdotes. On the left for Gold, its dominant overhead trading resister is 1234, and on the right for Silver its resistor is 17.450:
Finally these three quick items:
1) The email traffic during the week was comparatively rife with my blowing it on "Rolls Royce" as still being a unified aerospace engine and coach maker. My tendency toward hopeless romanticism only had me off by a few decades. The good news, despite the blunder, was nevertheless the ongoing enthusiasm for The Gold Update as expressed in those very same emails, so for that I remain humbly grateful, especially as we glide toward our fifth anniversary edition in a couple of weeks' time.
2) A FinMedia piece that ran during the week was headlined: "Amazon's 3rd quarter loss makes holidays a question mark". Whilst I find Amazon to provide an amazing service, what I've been questioning more for years on end is how the stock of this company -- which given little or no earnings oft finds its way onto our daily listing of the S&P 500's most expensive stocks -- can continually trade as high as it does, our current "live" p/e for it being 736x.
3) Lastly, we've got the latest Wells Fargo survey on retirement accounts pointing out that the typical American worker has saved just $20,000 for those Golden Years. To quote from a piece on the survey: "Middle-class individuals throughout the United States have a median of just $20,000 total saved for retirement, compared to the $250,000 necessary to sustain their way of lives after leaving their jobs". What's still more daunting is the prior survey's having the saved number at $25,000, so we're trending the wrong way. How much money shall thus have to be printed to keep us oldsters upright?