Get 40% Off
🎁 Free Gift Friday: Copy Legendary Investors' Portfolios in One ClickCopy for Free

The Mosaic Of Intel Points Higher

Published 12/01/2015, 01:43 AM
Updated 05/14/2017, 06:45 AM

Intel (O:INTC) is one of the stalwarts of the technology space. A general during the tech boom of the 90s and a core part of the computing world now. And today, the stock looks ready to make a major move higher.

I follow a mosaic approach when looking at stock charts of price action. When there are multiple forms of technical analysis that all point in the same direction, it re-enforces the view. And in Intel, the mosaic is strong.
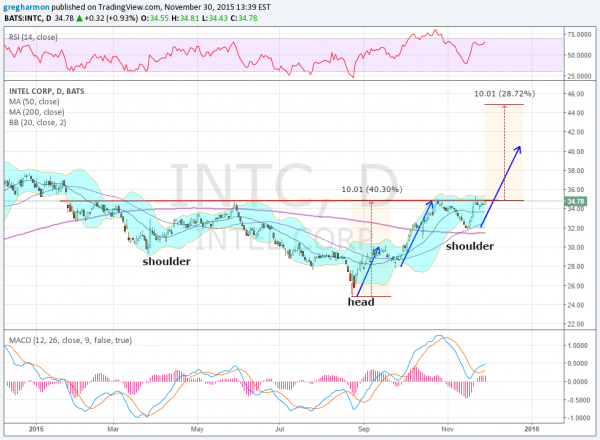
Intel Daily Chart

First there is the most famous of technical patterns, a Head and Shoulders. This is actually an inverse Head and Shoulders, and the price is right at the neckline. A break above that neckline would give a price objective of at least 44.85. The second is a 3 Drives pattern. This is a series of 3 moves higher with partial retracement. In the chart above, this one is building with a 127% extension the second thrust, so targeting 40.50 for the final 3rd thrust.

If that is not enough, the momentum indicators also support a move higher. The RSI is in the bullish range and holding. The unbounded MACD has crossed up and is rising. Finally, there was a Golden Cross that printed in mid November as the 50 day SMA crossed up through the 200 day SMA.

All of these reads point to more upside in Intel. So what are you waiting for?

Disclaimer: The information in this blog post represents my own opinions and does not contain a recommendation for any particular security or investment. I or my affiliates may hold positions or other interests in securities mentioned in the Blog. Please see my Disclaimer page for my full disclaimer.

3rd party Ad. Not an offer or recommendation by Investing.com. See disclosure here or remove ads .

Original post

Latest comments

Risk Disclosure: Trading in financial instruments and/or cryptocurrencies involves high risks including the risk of losing some, or all, of your investment amount, and may not be suitable for all investors. Prices of cryptocurrencies are extremely volatile and may be affected by external factors such as financial, regulatory or political events. Trading on margin increases the financial risks.
Before deciding to trade in financial instrument or cryptocurrencies you should be fully informed of the risks and costs associated with trading the financial markets, carefully consider your investment objectives, level of experience, and risk appetite, and seek professional advice where needed.
Fusion Media would like to remind you that the data contained in this website is not necessarily real-time nor accurate. The data and prices on the website are not necessarily provided by any market or exchange, but may be provided by market makers, and so prices may not be accurate and may differ from the actual price at any given market, meaning prices are indicative and not appropriate for trading purposes. Fusion Media and any provider of the data contained in this website will not accept liability for any loss or damage as a result of your trading, or your reliance on the information contained within this website.
It is prohibited to use, store, reproduce, display, modify, transmit or distribute the data contained in this website without the explicit prior written permission of Fusion Media and/or the data provider. All intellectual property rights are reserved by the providers and/or the exchange providing the data contained in this website.
Fusion Media may be compensated by the advertisers that appear on the website, based on your interaction with the advertisements or advertisers.
© 2007-2024 - Fusion Media Limited. All Rights Reserved.