Another night of very low volatility, highlighted with the S&P 500 and Dow Jones indices trading in a nine and 87-point range respectively. This is great for longer-term investors who don’t like to look at daily market gyrations, but it is obviously frustrating for the short-term traders out there.
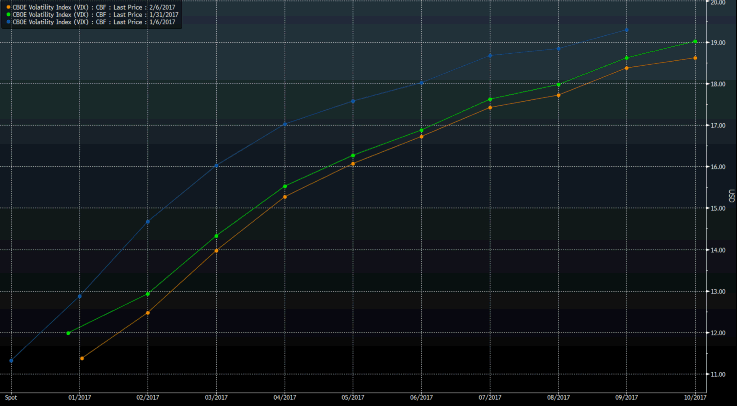
Of course, in this environment patience is absolutely required and traders shouldn’t force a position. The US volatility index (‘VIX’) at 11.35% really tells you so much about how the market views future volatility, but then we can also look out at forward VIX futures contracts and see the ‘curve’ (see Bloomberg chart below) is about as flat as we will ever see.
The fact is, implied volatility is super low and traders don’t see much to derail that at present.
(The orange line here represents the current VIX futures curve. The green is how it stood a week ago and blue, a month ago - a clear flattening a traders sell futures implied volatility)

The story of the overnight session has been the move lower in oil. Some focus has been on an update from the Energy Information Administration (EIA), detailing they see US output averaging 9.53 million barrels a day next year, up from 9.3 million forecast in its January report and this would be the highest levels since the 1970’s. This marries nicely with the US rig count, which has gained some 80% since May as shale gas firms bring back production on-line as price moves through their breakeven levels.
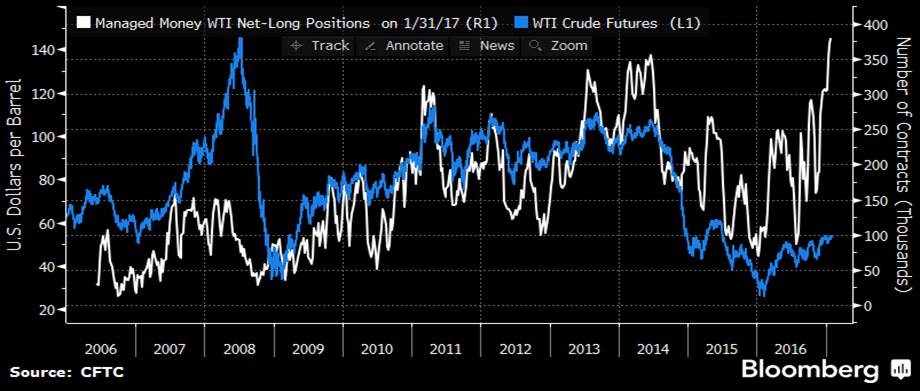
We should also be cognizant of the fact that US crude futures holdings by managed money have never been more bullish on the barrel, with a net long position of 380,000 futures contracts. Clearly, a position adjustment from a very crowded trade is in play. The wash-up here then is the balance of power is leaning to the idea that despite output cuts from OPEC (and select non-OPEC nations) price is starting to roll over as supply increases relative to demand.
There also seems to be some pre-positioning ahead of tonight’s (02:30 aedt) DoE inventory report, where crude inventories are expected to increase 2.695 barrels, with gasoline inventories gaining some 1.64 barrels.

Technically, the 10th January low at $51.59 (on US crude) seems key here as a break takes oil to $45 in my opinion. Of course, if this move materialises the impact will be felt not just on oil stocks, but inflation expectations too, although we can still see US five-year inflation expectations still just holding the 2% level.
The moves in oil should impact BHP negatively today, with its ADR down 1.2%. Bulk commodities look more upbeat though, with iron ore and steel futures offsetting the moves in oil, gaining 2% and 0.5% respectively. Spot iron ore gained 3.3%, but was playing catch-up to yesterday’s moves in the futures market. All eyes on Rio Tinto (NYSE:RIO) who report full-year earnings at 17:00 aedt, with the market looking for underlying NPAT of $4.75 billion, on revenue of $34.33 billion.
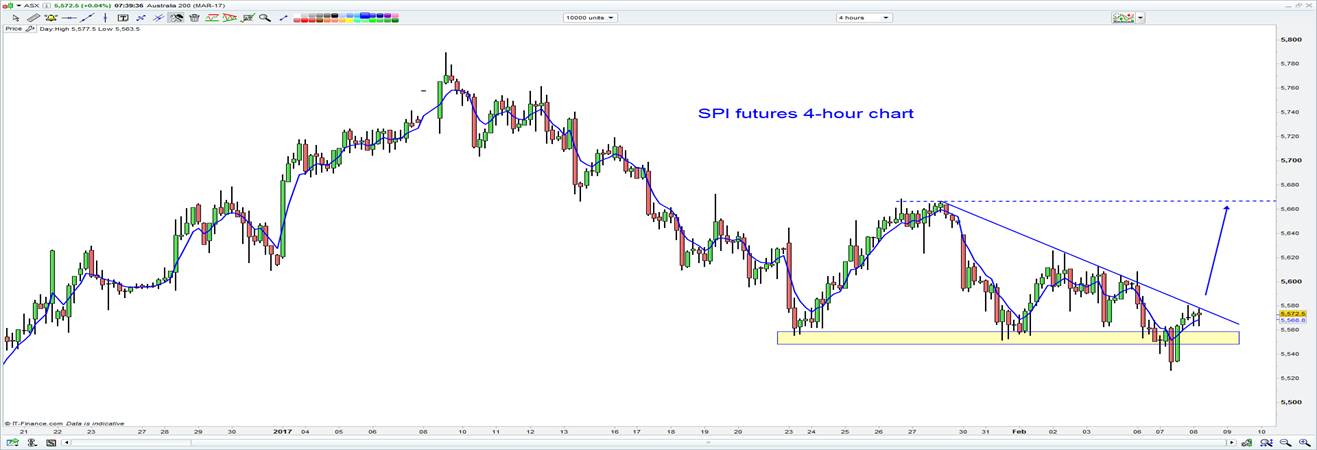
The broader ASX 200 looks set for an open around 5625, with SPI futures unchanged. We can see the bulls really stepping in the support price in the Aussie futures market yesterday and traders didn’t want to see a close below the key 5550 area I have been focusing on. A higher high today in price and we could be looking at the Aussie futures market really driving the ASX 200 (cash) market higher, with the ASX 200 potentially testing the 5660 area where we saw good supply in late January. The four-hour chart is probably the time frame worth focusing on here.

Aussie banks should open on a flat note, while WPL looks set to open down less than 1% (based on the ADR).
With the dust settling on yesterday’s RBA meeting the focus clearly shifts to Dr Lowe’s speech in Sydney tomorrow night (20:00 aedt) and then Friday's Statement on Monetary Policy (SoMP), where the view is we are going to see some fairly brutal cuts to the bank's GDP forecasts for end-2016 and June 2017. The wash-up of yesterday’s RBA statement though is the market has priced in a slightly higher degree of tightening, with eight basis points (bp) of hikes priced in over the coming 12 months (this stood at 4bp just before the release).
The AUD/USD has traded in a range of $0.7681 to $0.7606 on the session and currently sits mid-way through this range at present. GBP/AUD has been the bigger mover on the session though, with the GBP having a fairly constructive day after Bank of England member Forbes talked up the prospect of rate hikes – let’s not get too excited though about the BoE lifting interest rates, as the market is market is still only pricing in 11bp of tightening over the coming 12 months and are not pricing in a hike for 19 months. We can also add the headlines that UK PM Theresa May will visit China later this year, although this came out just after the rally in GBP had started.
