The leads for Asia are verging on the bearish side and we should see some modest weakness in equities, but the actual backdrop by which equities continue to operate in is improving.
US ISM manufacturing PMI increased to 53.2 (a five-month high), taking global manufacturing to a 27-month high and at 52.1 is thematic of global growth in the vicinity of 3.5%. The Atlanta Fed’s Q4 GDP model was revised 40 basis points (bp) higher to 2.9%, which is a nice growth rate to close out what has been another crazy year for markets, while we have heard from at least six auto companies who have suggested recent sales have been strong. Granted, this same inspiring data story cannot necessarily be said about Australia, where we saw some disappointing in the Q3 CAPEX data yesterday and the future investment ‘intensions’ were perhaps not as strong as some had hoped. We have seen some weakness in residential construction and housing remains a must watch for 2017, but on the whole things are ticking along and most importantly the interest markets are not pricing in ANY action from the RBA over the coming 12 months.
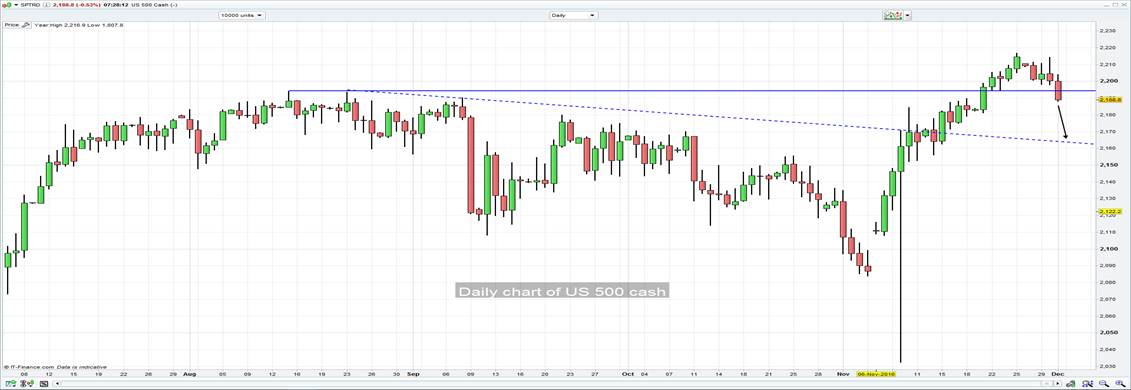
The interesting theme we can take away from the overnight session has been the continued move into financials and energy. These are the two hot sectors right now, while tech is rolling over, as are REITS and the broader S&P 500 has broken through the August highs and could see further weakness into 2164 (see chart). US bond yields have moved higher again, breaking to new highs in the Trump inspired sell-off (the US 10-year treasury is up 6bp at 2.44%), while US crude has seen good follow through buying, pushing up a further 3.3% from yesterday’s ASX 200 close and eyeing a test of the 10 October high of $52.74. This clearly explains this dynamic within the sectors, but it’s interesting that we have seen a reasonably strong move higher (+9%) in the US volatility index (aka the ‘VIX’), while USD/JPY has come well off its session high of ¥114.84, with the broader USD under pressure.

We can put the USD weakness down to position squaring ahead of tonight’s US payrolls report (00:30 AEDT), although it would need to be an absolute disaster for markets to really panic on this print. The consensus is we see 180,000 jobs created in November, which is in-line with the year’s monthly average of 189,000. Watch hourly earnings, as a print above 2.8% could see further upside in US treasury yields and this could keep this dynamic of long US financials, short tech and REITS working well. Given how loved the USD is right now we will need to see a print above 230,000 to get the USD bulls to add to current positioning.
Bringing this back to Asia, and while it was positive to see the S&P/ASX 200 close above 5500 yesterday, on volume some 34% above the 30-day average, we should see the index open around 5487 (-13 points) this morning. A close above 5507 will see the Aussie market close in the green for the week, but if we look at the various ADR’s (by way of a guide) it appears as if BHP will open on a flat note, while the banks should open around 0.5% weaker. Energy is clearly the place to be, although you can’t go past an 8.7% rally in spot iron ore, with iron ore and steel futures both up just over 3%.
In terms of event risks, I suspect the Australia October retail sales will not move the needle too greatly, with the market expecting 0.3% growth. AUD/USD has traded in a range of $0.7371 to $0.7420 overnight, finding inspiration from the strong moves in bulk commodities, while the USD side of equation was somewhat assisted by a fairly upbeat manufacturing print. I wouldn’t be expecting too much volatility in the pair today.
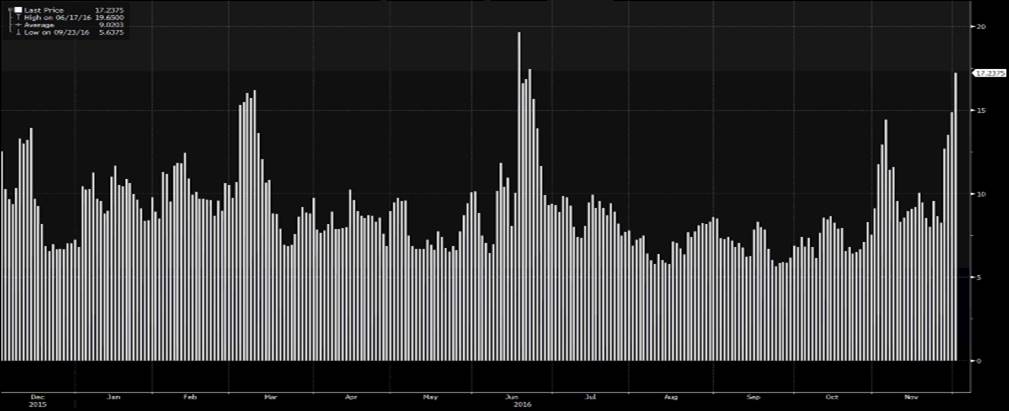
Perhaps the bigger consideration is the prospect of gapping risk in a number of assets on Monday, due to the Italian referendum on constitutional reform. If we look at EUR/USD one-week implied volatility (see Bloomberg chart below) we can see this measure trading up 16% overnight and the highest levels since the UK referendum. Traders’ have been happy to buy volatility structures as they feel we could see a strong move next week in EUR/USD and one suspects Italian debt and the MIB 40 too. The interesting point of differential between this event risk and say the US presidential election or UK referendum is that the polls have been suggesting we should see a ‘no’ vote since September and this result must be in the price to a large extent. The prospect of an early election being called if Matteo Renzi steps down and the President ultimately accepting his resignation seems low (but one can’t rule it out), and the prospect of national elections in 2018 is still very much the base-case.
Still, this is a ‘grey swan’ event, or a known unknown if you like and it does seems logical that a period of political uncertainty is likely to be ushered in, something the Italians know only too well having had 63 governments in the past 70 years! One suspects the market will turn to the ECB, who meet next Thursday to smooth over any volatility that could be created from the referendum.
EUR/USD – 1 week implied volatility

