Get 40% Off
☕ Buy the dip? After losing 17%, Starbucks sees an estimated 20% upside. See the top Undervalued stocks!Unlock list

The Downtrend Resumes

Published 06/07/2015, 02:39 AM
Updated 07/09/2023, 06:31 AM

Markets began to act sloppy this week and began to break below breakout levels late in the week.

I locked in all my gains Thursday and am now in an all cash position and looking for a little correction.

Unfortunately, Friday saw two of the stocks I sold have stellar days to the upside and I just watched.

I can’t win them all but the churning action we’ve seen more and more of in the past week makes me happy to have not take a single loss and just locked in gains.

Churning often leads to moves lower and markets are showing failed breakouts and June tends to be weak so I am cautious here.

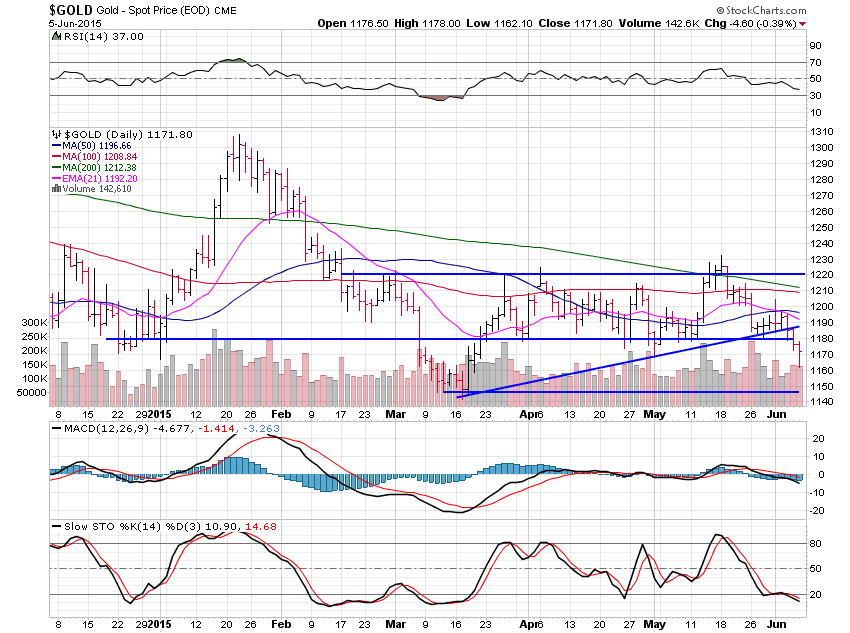
Gold and silver broke below the patterns I showed here last weekend and are set for more downside once again.

When the metals are breaking a perfect bearish pattern which says lower, as they are now, all I can hear are the crickets!
Gold Daily Chart

Gold lost 1.57% over the past week, which isn’t a lot, but it is breaking the continuation pattern triangle I have shown in this free letter.

There really isn’t much else to say.

Gold has support next at $1,150 and then we see what builds on the charts.

Subscribers knew the short level and many are now short gold and looking to book gains at $1,150.

I could go on but there is no need.

Charts keep things simple and clean if there is a pattern, if not, there is even less to say.
3rd party Ad. Not an offer or recommendation by Investing.com. See disclosure here or remove ads .

Silver Daily Chart

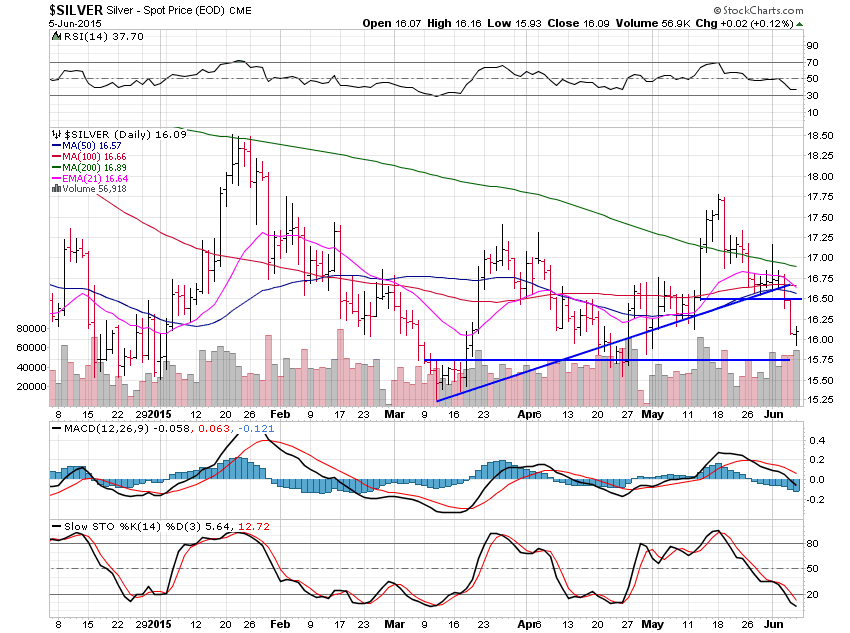
Silver lost 3.68% this past week and also broke below the bearish triangle pattern I showed here last weekend.

Silver found support near $15.75 since that is support on the chart and now it looks like it will move back up to test the $16.50 level.

The dominant trend remains lower and that’s that.

We may see some range bound trading for a few weeks or more between $15.75 and $16.50.
Platinum Daily Chart

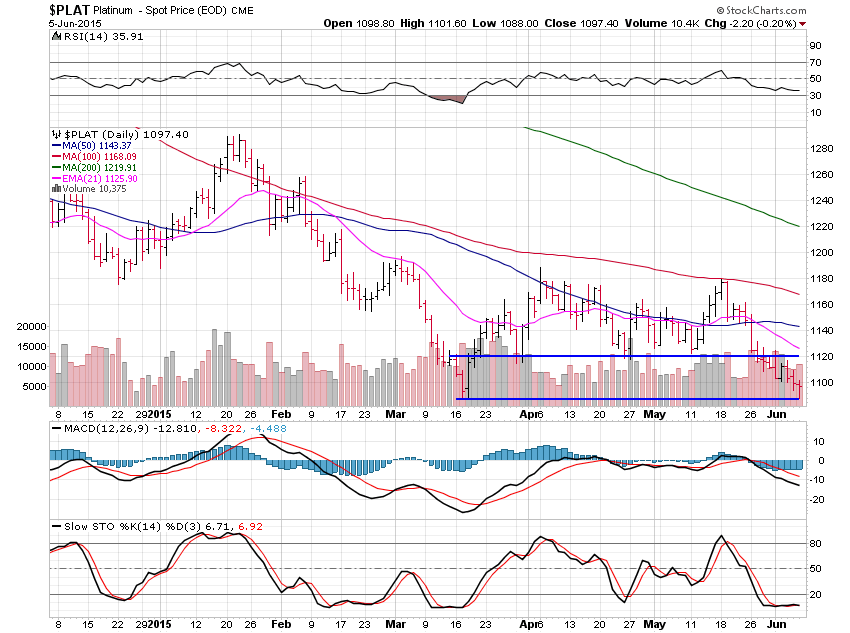
Platinum lost 1.28% and is following gold and silver as always.

Platinum tested the $1,090 level I talked about here last weekend as a support level and it looks set to bounce now.

I’d look for a range trade between $1,090 and $1,120 for a few weeks or more.
Palladium Daily Chart

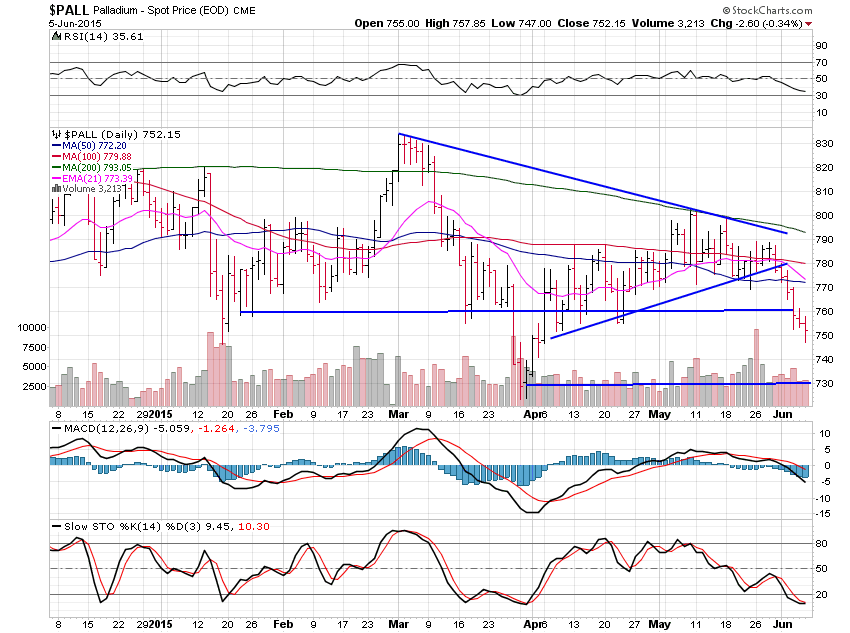
Palladium lost 3.20% last week and broke below the large triangle pattern I showed you here in me free weekend letter last weekend.

Palladium stalled around the $760 support level and flipped it to resistance by trading a few days under it before moving lower once again towards the next support area at $730.

Latest comments

Risk Disclosure: Trading in financial instruments and/or cryptocurrencies involves high risks including the risk of losing some, or all, of your investment amount, and may not be suitable for all investors. Prices of cryptocurrencies are extremely volatile and may be affected by external factors such as financial, regulatory or political events. Trading on margin increases the financial risks.
Before deciding to trade in financial instrument or cryptocurrencies you should be fully informed of the risks and costs associated with trading the financial markets, carefully consider your investment objectives, level of experience, and risk appetite, and seek professional advice where needed.
Fusion Media would like to remind you that the data contained in this website is not necessarily real-time nor accurate. The data and prices on the website are not necessarily provided by any market or exchange, but may be provided by market makers, and so prices may not be accurate and may differ from the actual price at any given market, meaning prices are indicative and not appropriate for trading purposes. Fusion Media and any provider of the data contained in this website will not accept liability for any loss or damage as a result of your trading, or your reliance on the information contained within this website.
It is prohibited to use, store, reproduce, display, modify, transmit or distribute the data contained in this website without the explicit prior written permission of Fusion Media and/or the data provider. All intellectual property rights are reserved by the providers and/or the exchange providing the data contained in this website.
Fusion Media may be compensated by the advertisers that appear on the website, based on your interaction with the advertisements or advertisers.
© 2007-2024 - Fusion Media Limited. All Rights Reserved.