Get 40% Off
👀 👁 🧿 All eyes on Biogen, up +4,56% after posting earnings. Our AI picked it in March 2024.
Which stocks will surge next?
Unlock AI-picked Stocks

Global Macro Currents

Published 09/16/2015, 04:24 AM
Updated 07/09/2023, 06:31 AM

Let's begin in the United States where economic data remains mixed. Here is the latest:
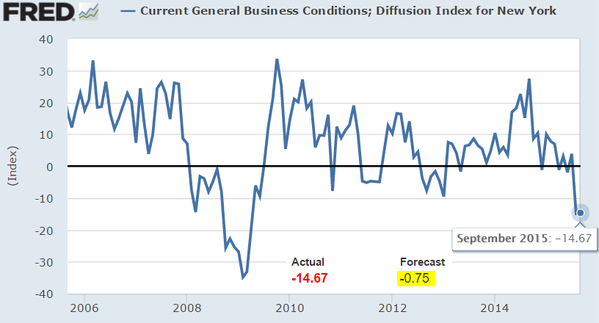
1. The Empire State Manufacturing Index (measuring NY-area manufacturing activity) is quite weak and materially below consensus.

Business Conditions
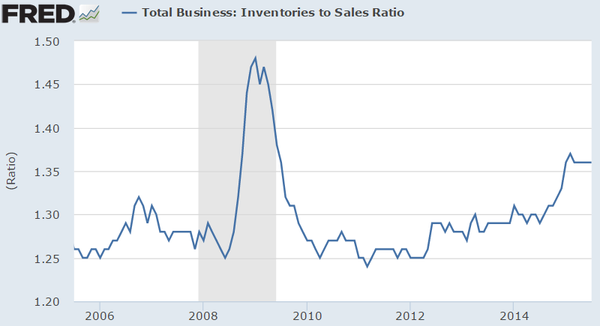
2. At the national level the inventories-to-sales ratio is still elevated. This means that US product isn't selling well.
Inventories Vs. Sales
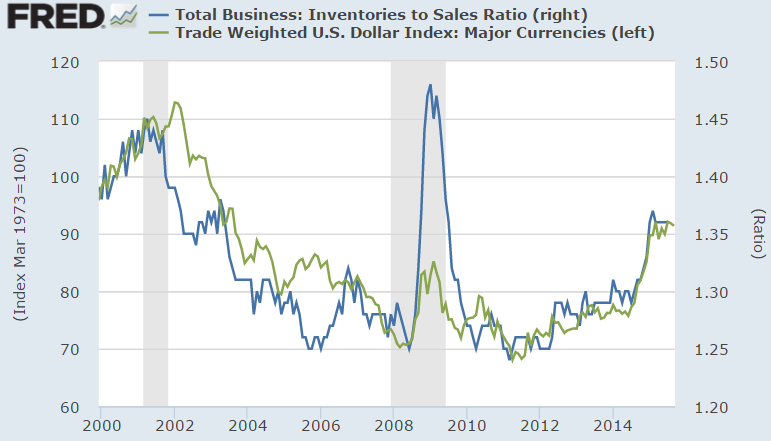
Moreover, here is the same chart vs. the trade weighted US dollar index - it's not difficult to see the relationship. A rate hike in this environment will push the dollar higher and put even more pressure on sales.
Inventories And Sales vs. USD
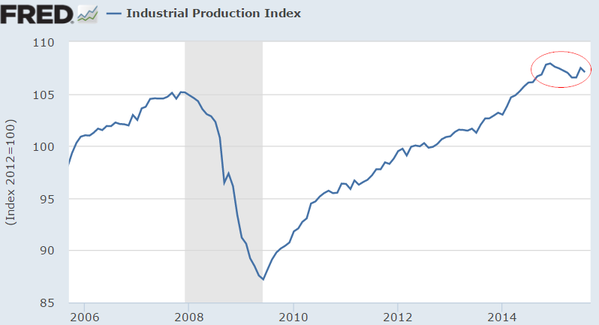
3. US industrial production growth has stalled - also as a result of a strong dollar.
Industrial Production
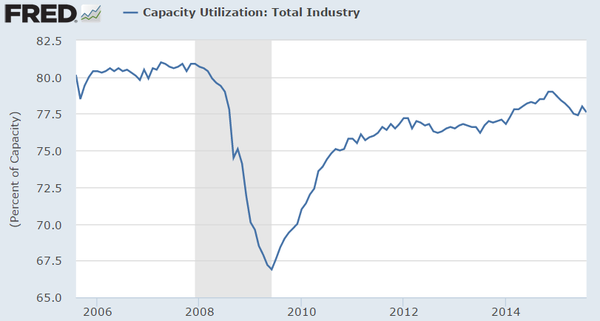
4. Related to the above, here is the capacity utilization.
Capacity Utilization
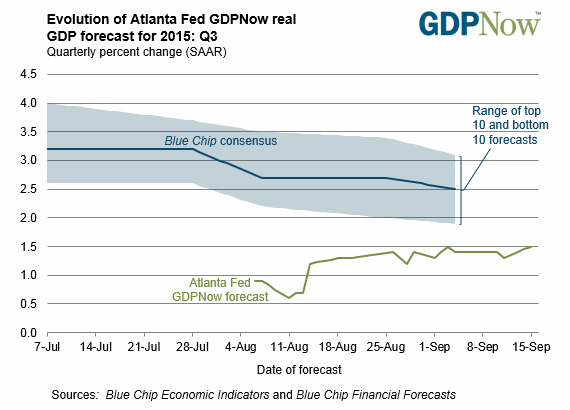
5. The Atlanta Fed latest GDPNow forecast for Q3 US GDP growth remains at 1.5%. All these indicators should give the FOMC some "food for thought".
GDP Growth
Source: Atlanta Fed
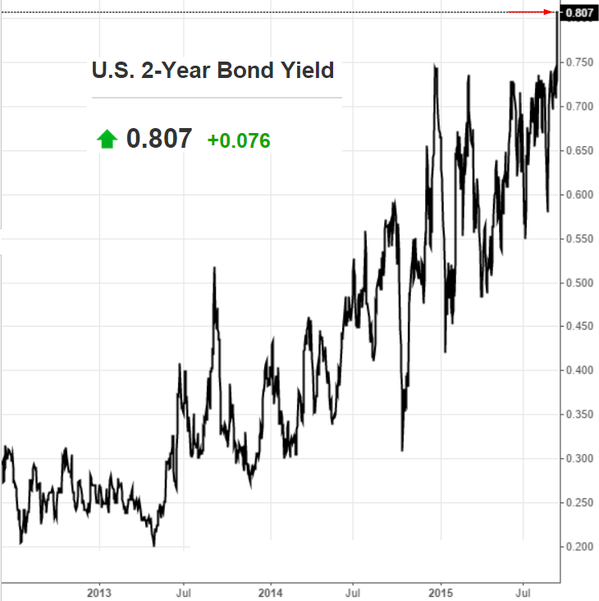
The treasuries market came under pressure on Tuesday. The short end of the curve had a particularly sharp move as the 2-year yield broke through the 75bp resistance.
2-Year T-Bill Yield
Source: Investing.com
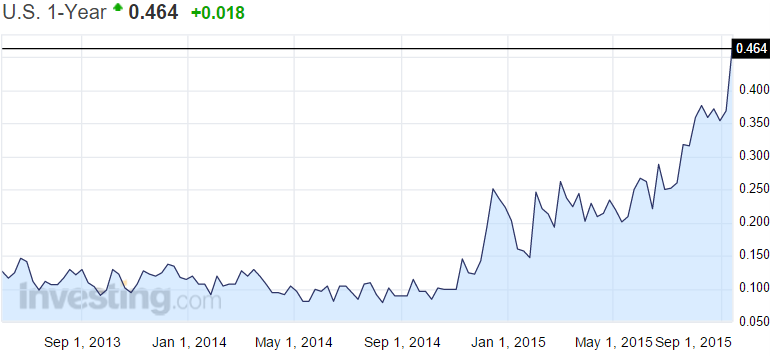
On a relative basis the recent increase in the 1-yr bill yield was especially large.
1-Year T-Bill Yield
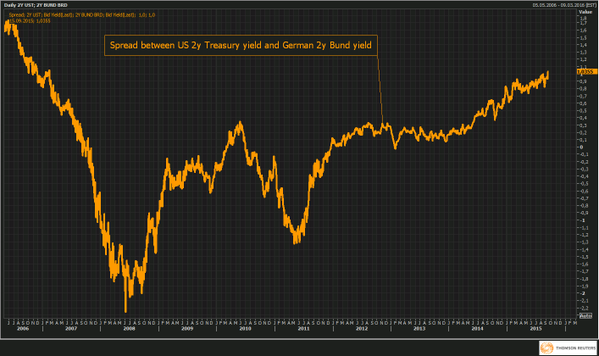
Related to the above, the spread between the 2-year treasury and Bund yield is at the highest level since 2007.
US 2 Year Vs. German 2-Year Bund
Source: @Schuldensuehner
3rd party Ad. Not an offer or recommendation by Investing.com. See disclosure here or remove ads .
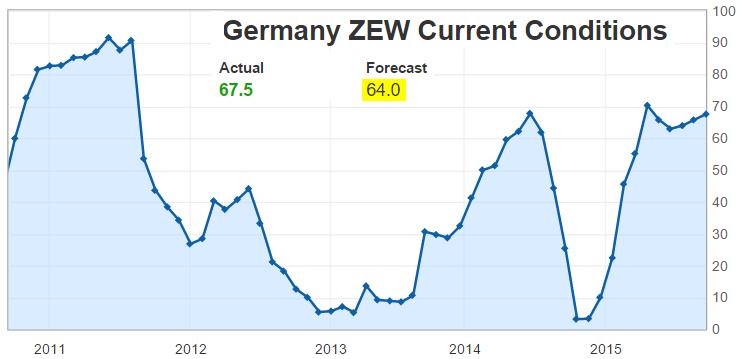
Turning to Germany, we see mixed business sentiment data. The ZEW Current Conditions index beat expectations.
German ZEW Current Conditions
Source: ‏Investing.com
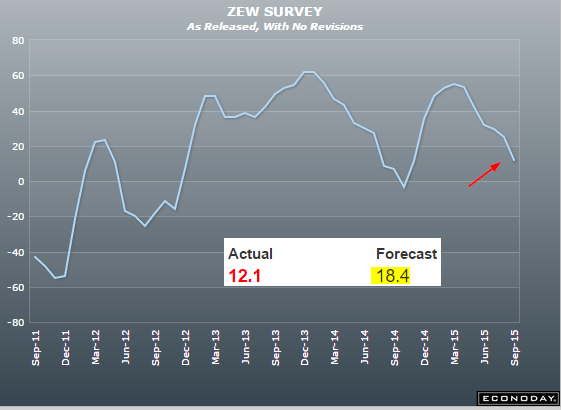
On the other hand future business expectations worsened on China-related jitters, pushing the overall ZEW index below consensus.
ZEW
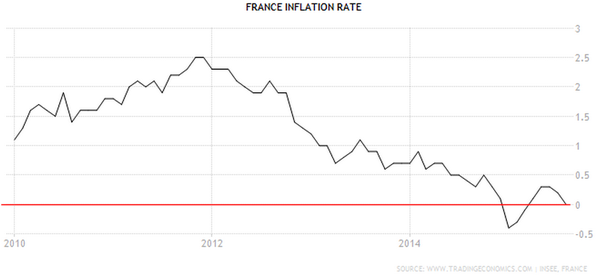
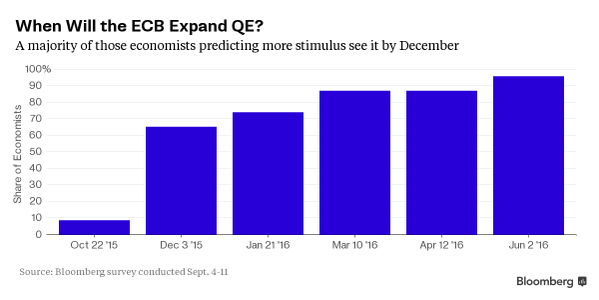
The ECB hopes the latest bout of disinflation (see France's CPI below) in the Eurozone is transient. Nevertheless most economists now expect the QE program to be expanded.
French Inflation
QE Outlook
Source: @andretartar, @business
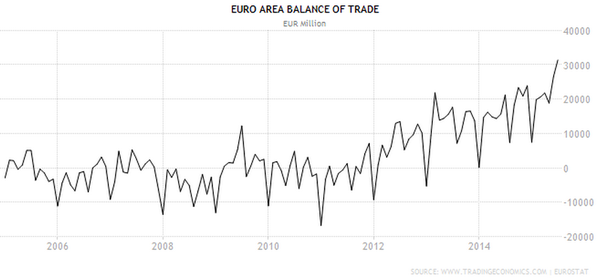
The euro area trade surplus hit a record recently.
EU Balance Of Trade
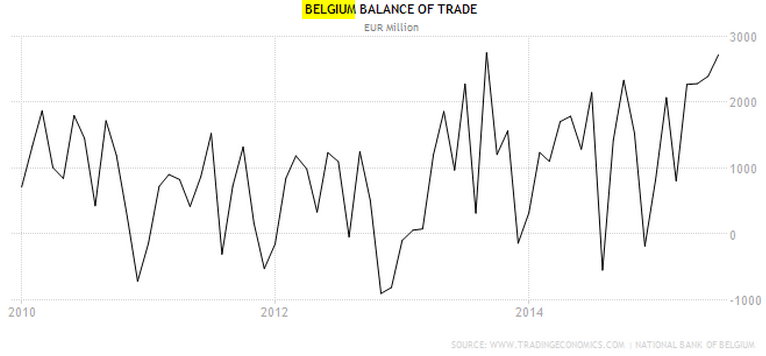
Much of this is driven by Germany, but other member states have contributed as well.
Belgium Balance Of Trade
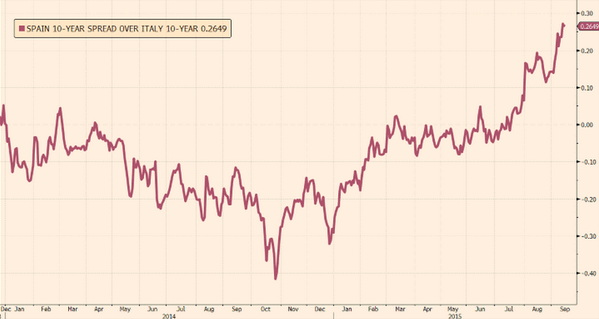
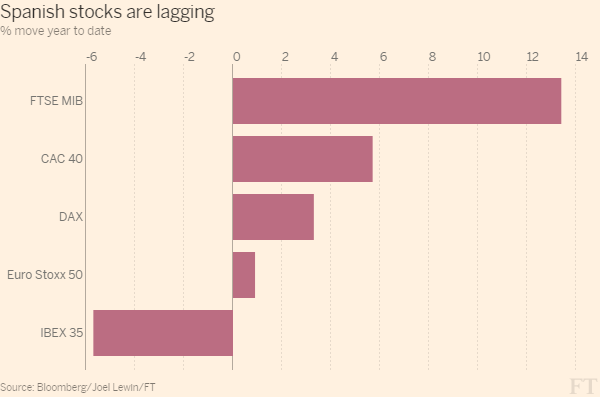
Political risks continue to hound Spain as Catalonians push for independence. The Spain-Italy government bond spread has widened further -- in spite of Spain's economy growing faster than most nations in Europe. Spanish stocks are underperforming as well.
Spanish 10 Year Vs. Italian 10 Year
Source: @JoelLewin
European Stocks
Source: @fastFT
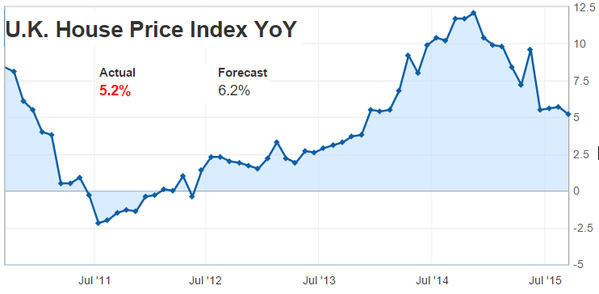
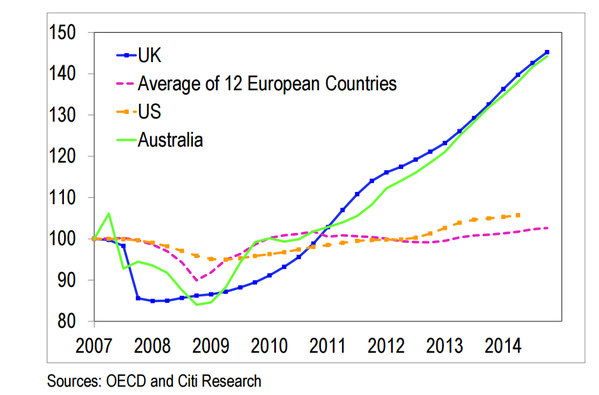
We see conflicting housing data from the UK as the Office of National Statistics index shows UK house prices appreciating at about the same rate as the US. That was considerably below consensus.
UK Housing
Source: Investing.com
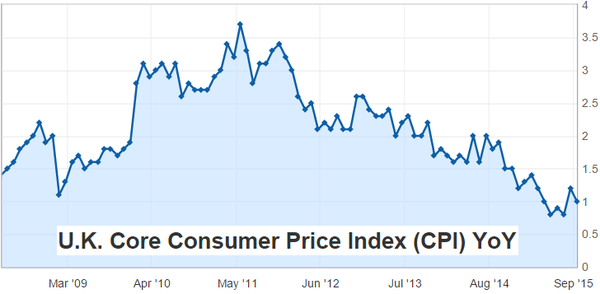
The UK's inflation remains subdued. The BoE is comfortably on hold until 2016 - especially given the cooling housing price appreciation (above)..
UK Inflation
Source: Investing.com
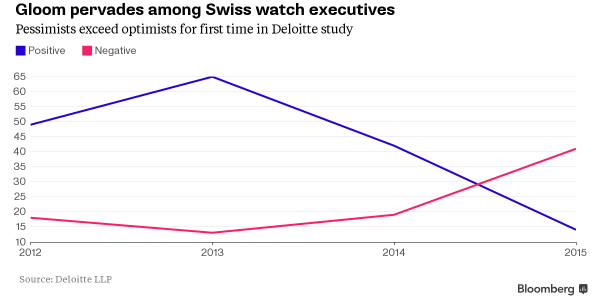
Based on yesterday's discussion, some readers have asked why a strong franc is such a bad thing for Switzerland. Here is just one example.
3rd party Ad. Not an offer or recommendation by Investing.com. See disclosure here or remove ads .
Executive Outlook
Source: ‏@business
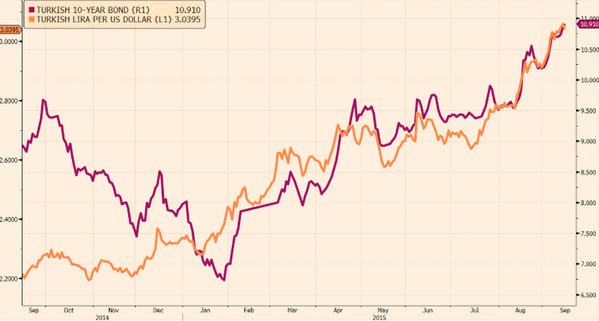
Turning to emerging markets, Turkey's latest bond auction resulted in the nation's government paying the highest interest rate in 6 years. The chart below shows Turkish yields rising as the currency falls (one dollar buys increasingly more lira).
Turkish Yields
Source: ‏@fastFT
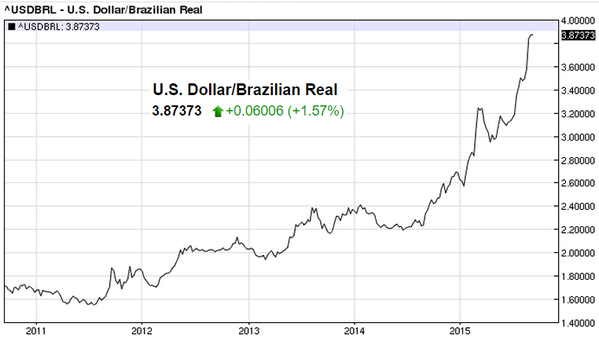
Brazil embraces austerity by announcing spending cuts and higher taxes. Moody's applauded the move, which should be a positive for the nation's debt valuations. Nevertheless the real still trades near record lows vs. the dollar.
USD/BRL
Source: barchart (chart shows number of reals one dollar buys)
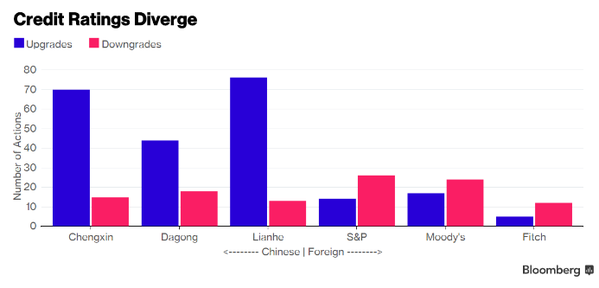
For years China wanted to build its own rating agencies. It got them now -- but they are just a bit biased. Too much downgrading would just be "unpatriotic".
Credit Ratings
Source: @SandyHendry @business
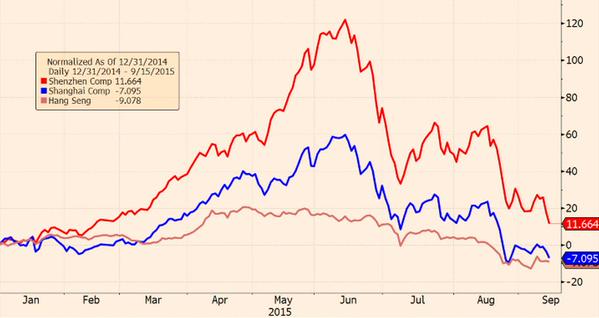
China's stock market is now down about 7% on the year after being up some 60% in June. Incredible.
Chinese Stocks
Source: ‏@fastFT, @patrickmcgee
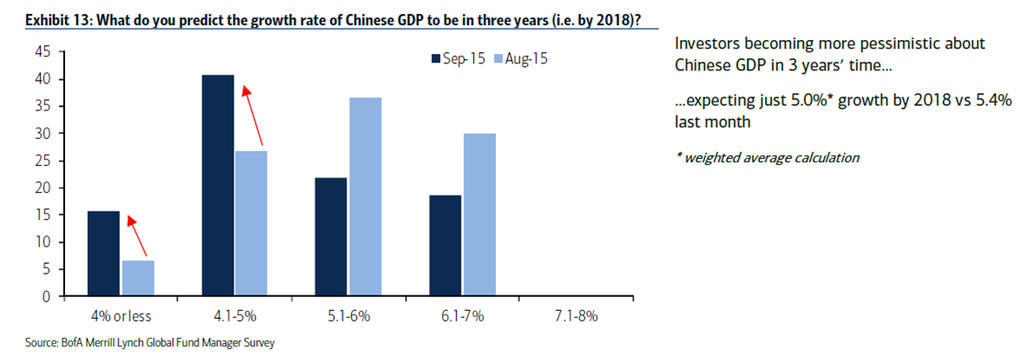
By the way, investors have really downgraded their expectations for China's growth.
Chinese Growth
Source: @jsblokland
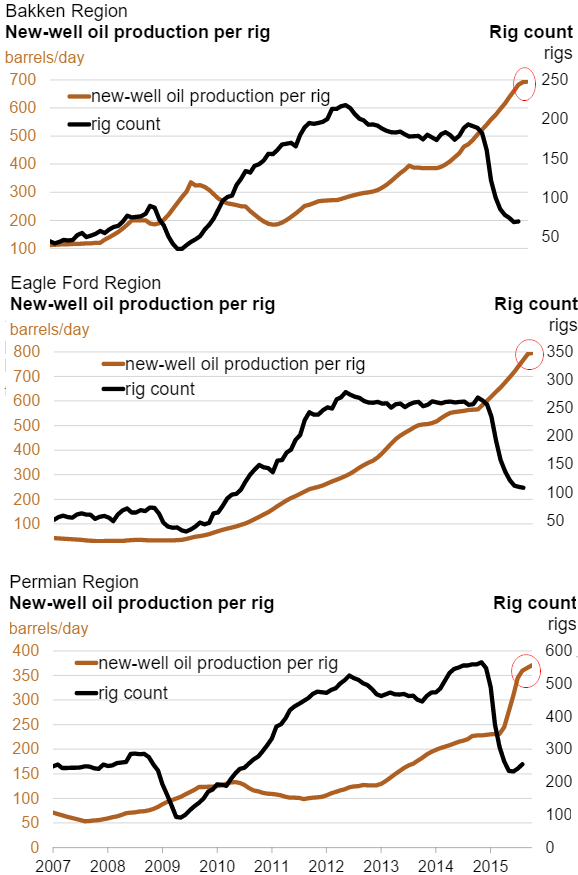
Switching to the energy markets, can more efficiency be wrung out of US oil rigs or are we reaching limits? Efficiency growth seems to have stalled as the less efficient rigs have been taken offline.
Bakken Production
Source: ‏EIA
The Swiss-based commodities trader Glencore (LONDON:GLEN) is trying to recapitalize itself in order to survive the collapse in commodity prices.
3rd party Ad. Not an offer or recommendation by Investing.com. See disclosure here or remove ads .
Wall Street Journal Clip
Source: WSJ
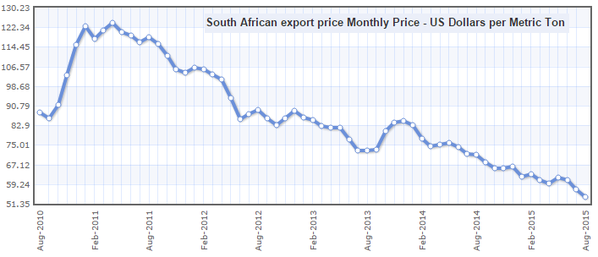
It's been particularly hurt by falling coal prices as the (China-driven) good times come to an end.
Coal
Source: index mundi
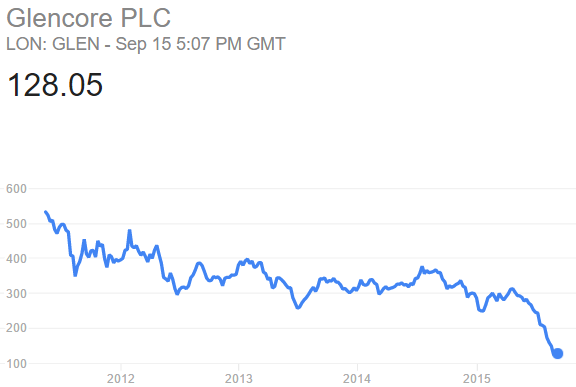
Here is the share price.
Glencore
Source: Google (NASDAQ:GOOGL)
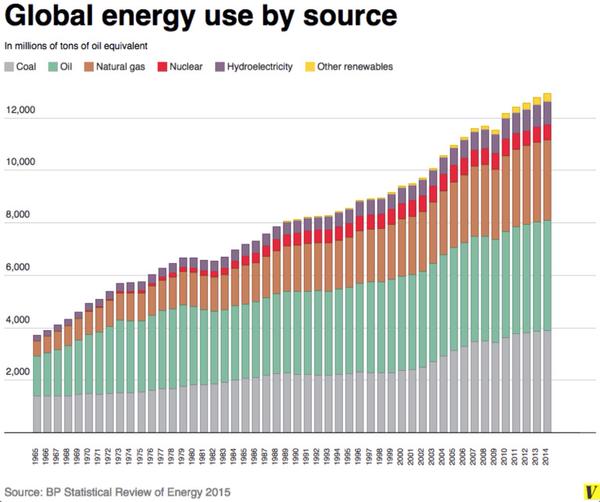
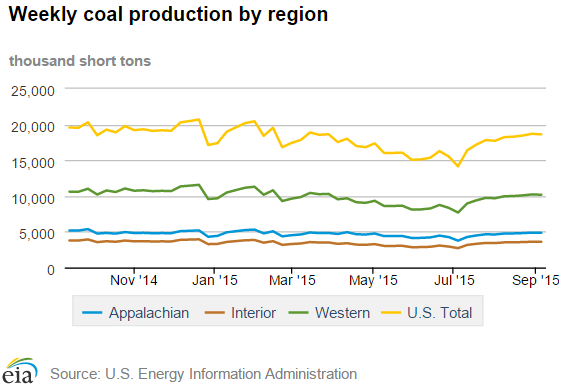
By the way, coal is not going away any time soon. In fact coal production in the US has risen recently.
Energy Use
Source: @paul1kirby
Regional Coal Production
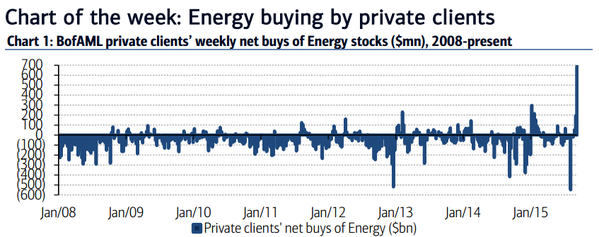
According to BAML, investors are out there buying shares of energy companies. Is this a bet on higher oil prices?
Energy Buys
Source: @NickatFP
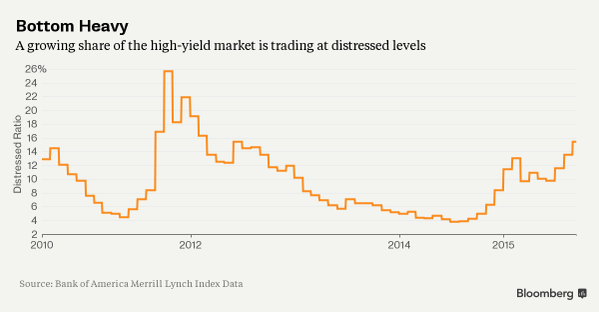
Staying with the energy theme, HY defaults are about to jump as levered energy firms run out of cash. Yes, energy prices will go up but it will be too little too late.
High-Yield Defaults
Source: @markets
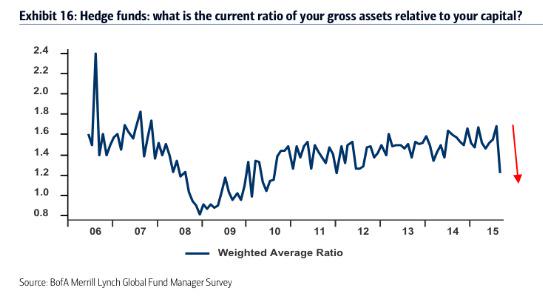
Hedge funds have been aggressively deleveraging in this latest selloff. It explains some of the unusually elevated volatility.
Hedge Fund Assets
Source: @LadyFOHF, BAML
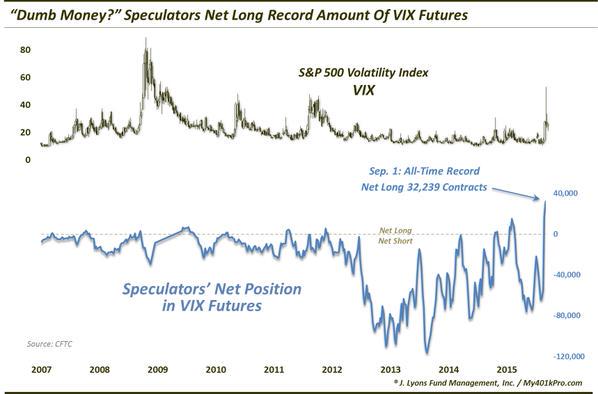
Related to the above, speculative accounts hold an outsize net long position in VIX futures. These are all positive signs for the US equity market.
Volatility
Source: @Callum_Thomas, @JLyonsFundMgmt
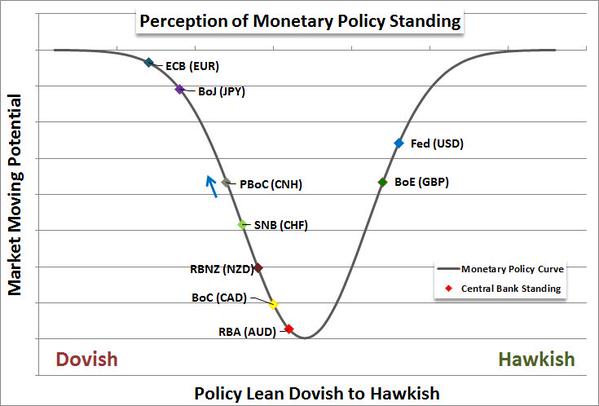
Finally, before going to Food for Thought, here is another reason a rate hike in the US at this point could be a mistake. Global monetary policy out of sync with the US - and is becoming more out of sync.
Monetary Policy Perception
Source: @JohnKicklighter
3rd party Ad. Not an offer or recommendation by Investing.com. See disclosure here or remove ads .
Turning to Food for Thought, we have 4 items this morning:

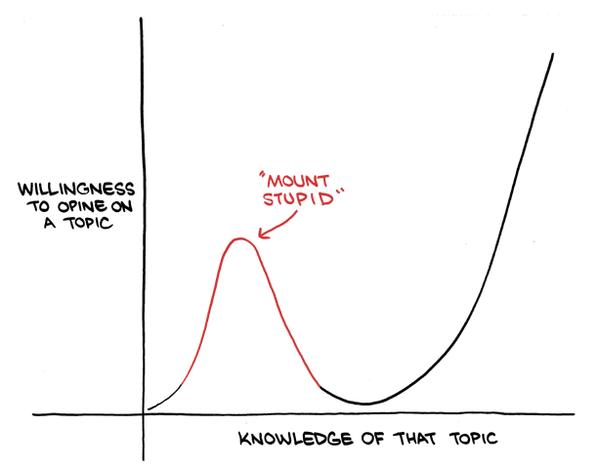
1. They tell us to avoid "Mount Stupid" (below). However a great deal of social media is built on it.

Mt. Stupid
Source: ‏@M_McDonough
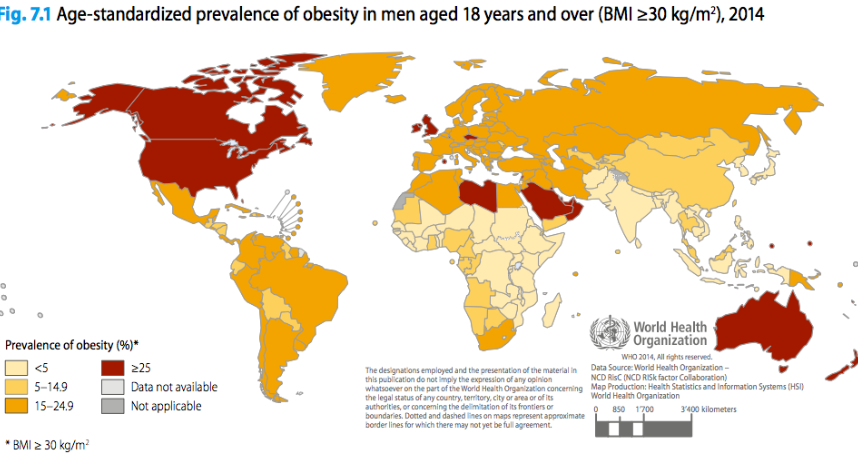
2. Prevalence of obesity in men by country.
Obesity
Source: @MaxCRoser
3. Business start-ups for select countries. As discussed yesterday, business formation in the US has spiked recently (according to the Morgan Stanley (NYSE:MS) index), but it's not yet reflected in this chart.
Business Formation
Source: ‏ ‏@business
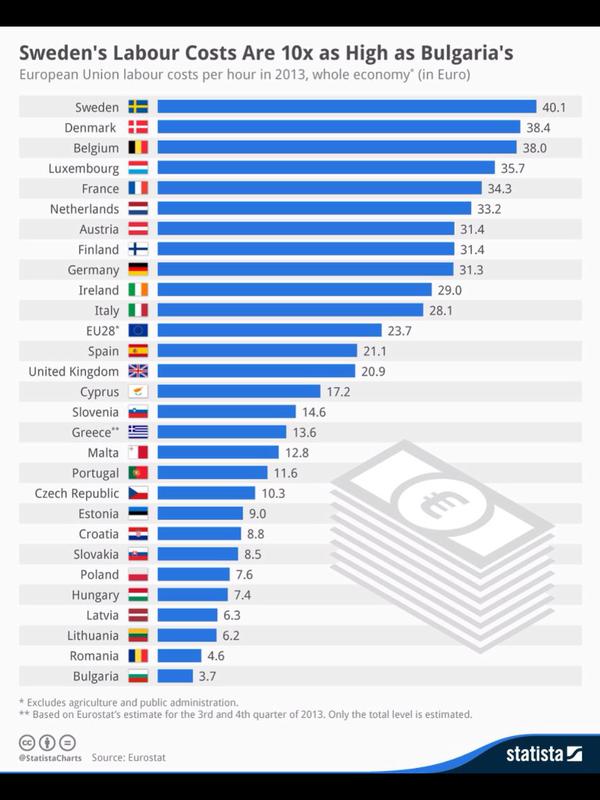
4. Labor costs vary dramatically across Europe.
Labor Costs
Source: ‏@Suntimes (Chicago Sun-Times)

5. This man says the more Donald Trump speaks, the more Trump piñatas he sells. There's going to be tons of business Wednesday evening.

Disclosure: Originally published at Saxo Bank TradingFloor.com

Latest comments

Risk Disclosure: Trading in financial instruments and/or cryptocurrencies involves high risks including the risk of losing some, or all, of your investment amount, and may not be suitable for all investors. Prices of cryptocurrencies are extremely volatile and may be affected by external factors such as financial, regulatory or political events. Trading on margin increases the financial risks.
Before deciding to trade in financial instrument or cryptocurrencies you should be fully informed of the risks and costs associated with trading the financial markets, carefully consider your investment objectives, level of experience, and risk appetite, and seek professional advice where needed.
Fusion Media would like to remind you that the data contained in this website is not necessarily real-time nor accurate. The data and prices on the website are not necessarily provided by any market or exchange, but may be provided by market makers, and so prices may not be accurate and may differ from the actual price at any given market, meaning prices are indicative and not appropriate for trading purposes. Fusion Media and any provider of the data contained in this website will not accept liability for any loss or damage as a result of your trading, or your reliance on the information contained within this website.
It is prohibited to use, store, reproduce, display, modify, transmit or distribute the data contained in this website without the explicit prior written permission of Fusion Media and/or the data provider. All intellectual property rights are reserved by the providers and/or the exchange providing the data contained in this website.
Fusion Media may be compensated by the advertisers that appear on the website, based on your interaction with the advertisements or advertisers.
© 2007-2024 - Fusion Media Limited. All Rights Reserved.