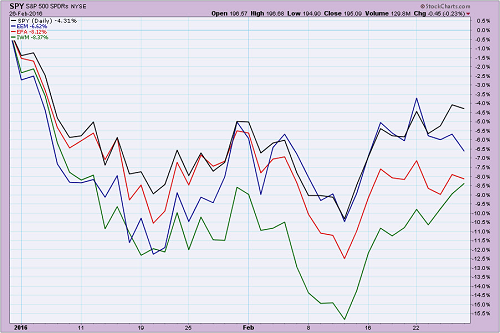
While the current equity charts do have a similar look to October’s bounce, they are still missing the anxious buying power that we saw then. If you look back to October 2015, we had an extremely sharp sell off in August and September caused by a significant lowering in global growth expectations. This was followed by a very positive October earnings period where several large technology stocks blew the doors off their estimates (Amazon (O:AMZN), Microsoft (O:MSFT) and Google (O:GOOGL)). Throw in the dovish comments by several central bankers and the market bounce charged ahead at full speed.
This bounce looks different. The markets are tired of central bank jawboning. We don’t have a March earnings period to get investors fired up. And several large market groups are acting terrible: Financials, Housing, Energy and most International Equities. Small Caps, Industrials and High Yield are trying to heal themselves but will it be enough? The markets daily correlation with oil has moved to a new extreme and rising intra-day volatility shows investors have little conviction in their positioning. The 1950 level seems to be the dodge ball line for both the fundamental and technical investing crowds. So we will watch and wait. And while we wait, several of you are making good coin owning precious metal stocks and their miners.
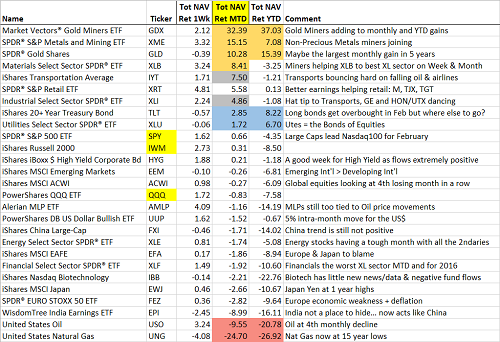
In looking at the monthly returns, gold and Mining still owns the top of the list. Some equity groups like Transports and Retail have fought their way back toward flat YTD returns. Fixed Income is still clicking away at positive monthly returns. Energy and International remain in the dog house…
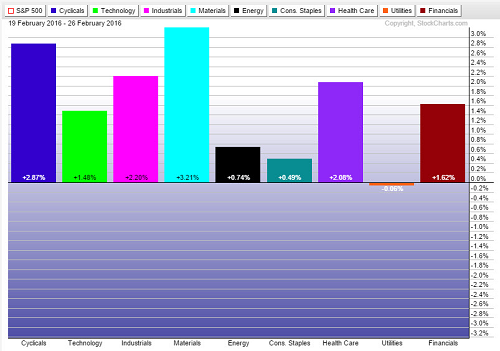
For the week, the sectors saw broad gains with Materials leading…
JPMorgan’s Trading Desk is also helping to draw the 1950 line in the sand…
As impressive as the mid/late-February rally has been, the SPX shouldn’t be chased north of 1950 for the time being given the insurmountable multiple/earnings math ($120 and 16x). The nature of trading at the moment (investors caught offside and not prepared for the recent surge, relative vacuum of news in the dead zone between earnings seasons, and the ~2 weeks wait time between now and the ECB) could help fuel a further squeeze higher in the SPX but such strength will likely prove ephemeral. The key to this tape prob. for the rest of the year will be equanimity, both on the upside and downside. (JPMorgan)
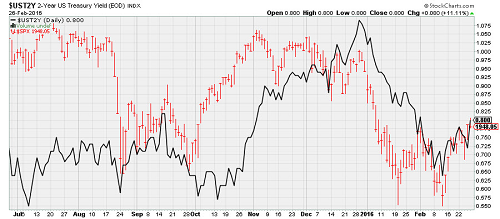
The recent creep in inflation data points has begun to lift the two-year Treasury yield again. In the past this was good news for equities because we expected it to be combined with rising U.S. growth. But is the growth outlook really improving? That is not what corporate earnings have been suggesting.
Hedge Fund’s long equity books have gotten their teeth kicked in for the last six months…
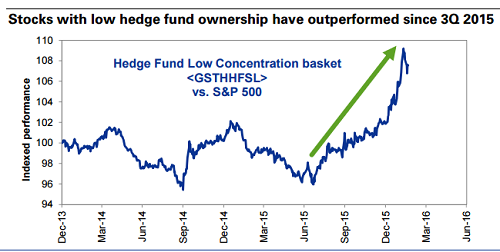
(Goldman Sachs (N:GS))
…But the winds are definitely shifting in favor of Active, Hedged investing…
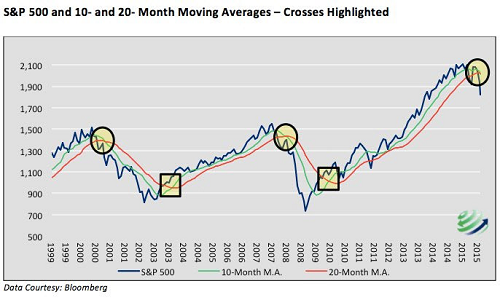
(@Callum_Thomas)
If you are tired of the tight correlation between Oil and U.S. Equities, then you will hate this chart. Now perfectly correlated for 3 months in a row on the weekly data…
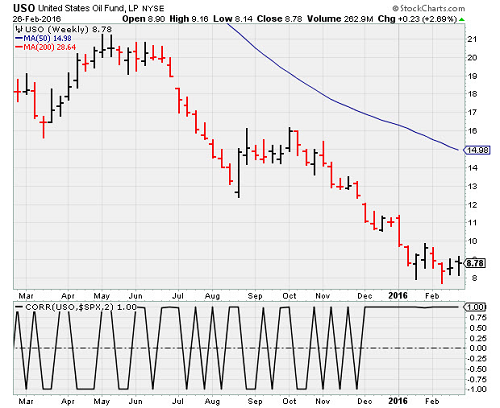
(h/t Arthur Hill, Stockcharts)
While OPEC members attempt to speed date all other producing nations and talk them into slowing production, the U.S. players continue to pump. Only problem now is that the U.S. players will have nowhere to store their production come summertime…
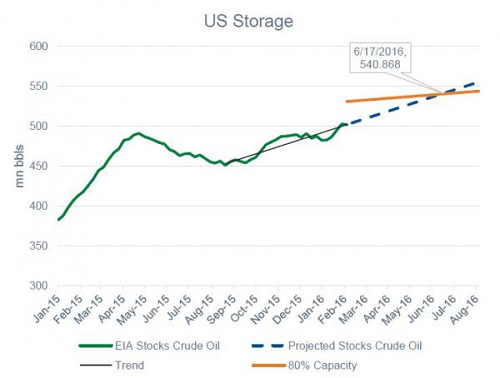
Oil industry participants gathered for a big conference last week. It was not a good time…
Dozens of indebted US shale companies face annihilation over coming months as their hedge protection runs out and creditors pull the plug, but veteran frackers insist defiantly that the slump will not stop the industry’s march to world conquest.
“What is happening scares the heck out of you. We’re going to see a decimation for the industry, with bodies and corpses all over the place,” said Mark Papa, the former head of EOG Resources (N:EOG).
“Lower for longer, is starting to feel like the Great Depression. You run for cash. You ride out the storm,” said John Hess, founder of the Hess Corporation (N:HES).
“It is probably a three-year process and we’re in the middle of it. The impact on investment has been devastating,” he told the IHS CERAWeek summit of energy leaders in Houston.
“Our activity is at a bare minimum, and we’re just preserving our operational capability. We had 17 rigs two years ago, eight last year, and now we’re running two. Very few things make sense at $30. It’s better to leave the oil in the ground,” he said.
Mr. Papa said the 70pc crash in oil prices since mid-2014 will wipe out those companies that leveraged to the hilt betting that crude prices would stay above $100 forever.
Houston wanted to avoid the Energy meltdown hitting their economy. Maybe next time…
In River Oaks, a neighborhood of palatial mansions and lush gardens, the average sales price of a home has tumbled to $1.3 million from $2 million in the middle of 2014 when oil began its more than 70 percent slide, according to data from the Houston Association of Realtors and Keller Williams. Median property prices in the area have already fallen further in this downturn, which is not yet over, than the 16 percent drop in the previous oil slump in 2008 and 2009.
“When oil does well, River Oaks does well. When oil does bad River Oaks does bad,” said Paige Martin, a Keller Williams broker who specializes in the neighborhood. “Not everybody can afford a $10 million house.”
There actually was quite a bit of talk at CERAWeek on the structural shifts happening in energy demand. Even EVs became a hot topic…
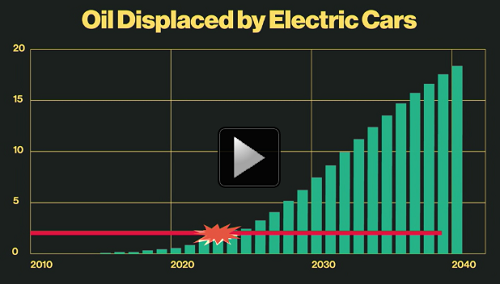
It’s time for oil investors to start taking electric cars seriously.
In the next two years, Tesla (O:TSLA) and Chevy plan to start selling electric cars with a range of more than 200 miles priced in the $30,000 range. Ford (N:F) is investing billions, Volkswagen (DE:VOWG_p) is investing billions, and Nissan (OTC:NSANY) and BMW (DE:BMWG) are investing billions. Nearly every major carmaker—as well as Apple (O:AAPL) and Google (O:GOOGL)—is working on the next generation of plug-in cars.
This is a problem for oil markets. OPEC still contends that electric vehicles will make up just 1 percent of global car sales in 2040. Exxon’s forecast is similarly dismissive.
The oil price crash that started in 2014 was caused by a glut of unwanted oil, as producers started cranking out about 2 million barrels a day more than the market supported. Nobody saw it coming, despite the massively expanding oil fields across North America. The question is: How soon could electric vehicles trigger a similar oil glut by reducing demand by the same 2 million barrels?
SocGen’s Albert Edwards reminds us of a very BIG miss to our portfolios…
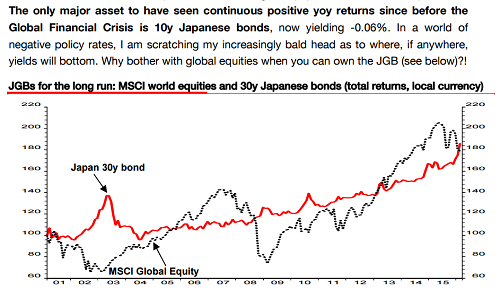
Of course Central Banks had a hand in helping all assets, even Japanese Bonds. But where will the Central Banks take bonds from here?
There’s a paradox at the heart of this bond boom that is possibly even more disturbing: On the one hand, central bankers are promising greater economic growth and inflation, which should make these bonds less attractive. On the other, they’re pursuing policies that would further lower benchmark borrowing costs, pushing investors into these notes.
This feels like an unsustainable tension. One of two things can happen: Either inflation will pick up, leading European and Japanese central bankers to start talking about abandoning their negative-rate policies and possibly spurring a big selloff in these longer-dated notes. Or else inflation won’t pick up, the global economy will slow even more and these bonds will continue to be attractive.
David Einhorn thinks the Central Banks have a problem and he is shorting Industrials…
“Bulls are assuming the current commodity environment is an ordinary cyclical downturn,” Einhorn said Tuesday on a conference call discussing results for Greenlight Capital Re Ltd., the Cayman Islands-based reinsurer where he is chairman. “We believe it is the end of a commodity supercycle, and this will exert a long period of earnings headwinds for these companies.” He didn’t specify which manufacturers he’s shorting…
The hedge fund manager hasn’t been bearish on all commodities. He said Tuesday that he expects the price of natural gas to recover over the next year. He also maintains a large stake in gold, which he’s held for years, sticking with the view that central banking stimulus efforts will stoke inflation. He endured the metal’s decline in 2015, and it has rebounded this year.
“Currently, market participants seem to be concerned about a global slowdown, and are losing faith in central bankers,” he said. “The U.S. economy is challenged due to the strong dollar and beaten-down energy sector, and policymakers have very little room to maneuver in the event of a real downturn.”
Another large hedge fund manager, Dan Loeb of Third Point, is looking at Energy investing via credit…
“We’re watching the energy markets very, very closely. We think that the better opportunities are on the credit side than on equities, as far as discounting potential bad news ahead,” he said. Energy stocks face the risks of high debt levels and “now the threat of equity offerings to shore up the balance sheets.”
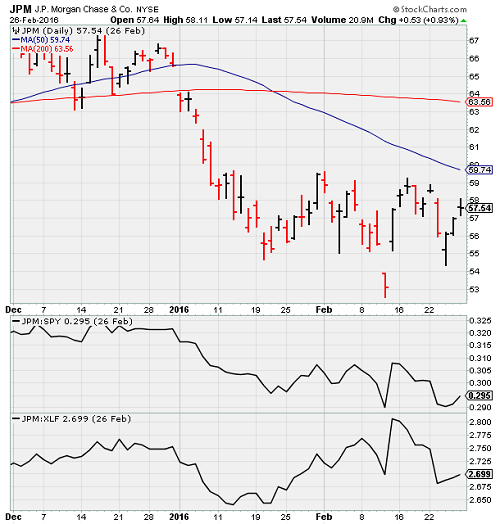
JPMorgan has credit exposure everywhere. Last week their comments on rising Energy problems spooked JPM and all bank stock investors…
JPMorgan Chase (N:JPM) has warned of growing stresses in its oil and gas portfolio, saying it would pump up its reserves for loan losses by about 60 per cent in the first quarter.
The disclosure, made at the bank’s annual day-long presentation to investors, came just weeks after it made its first net addition to its provisions for loan losses in the past six years. A $67m provision for the fourth quarter brought total reserves for oil and gas losses to $815m, across a portfolio with a book value of $44bn.
But on Tuesday the bank said it was looking to add another $500m of reserves, and said that it was stress-testing its portfolio for another drop in crude from current levels of about $32 a barrel. If the price were to stick at about $25 for the next 18 months, it said it might need to add another $1.5bn to reserves.
JPMorgan’s warning came as separate industry-wide figures showed US banks are setting aside more funds to cover expected losses from bad loans. Lenders made $12bn worth of provisions in the fourth quarter, up from $8.3bn a year earlier — the largest rise in six years.
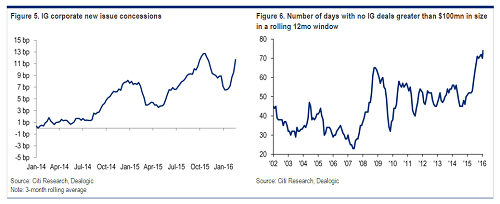
While the credit markets are looking at a large year of refinancing, the appetite for new paper is easing…
“It’s the increased irregularity of the new issue flows that’s concerning, particularly since we may have something on the order of $570 billion of maturities to get refinanced by year-end,” write Citi analysts led by Stephen Antczak. “Throw in the M&A pipeline, and it’s a large number to push through a stop-and-go primary market.”
Indeed, by Citi’s calculations the market for significant new investment-grade deals saw 75 “no go” days over the past 12 months, in which the primary market was essentially shut. That’s a higher rolling 12-month figure than was seen during the depths of the financial crisis in 2008 to 2009.
New issue concessions have by necessity become somewhat juicier as companies are forced to lure investors back into the market with higher yields.
…and the credit markets largest appetite just underwent gastric bypass surgery…
With debt markets showing the first signs of life in weeks, Wall Street banks are trying to break a logjam that could leave them with big losses on $88 billion of risky corporate loans. They won’t get much help from one of their most reliable buyers.
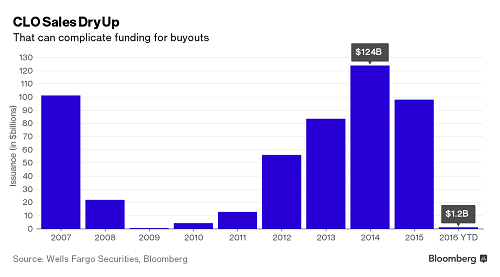
Collateralized loan obligations, or bonds backed by pooled corporate debt, bought more than 61 percent of the leveraged loans sold last year. This year, CLOs are struggling to get off the ground having raised just $1.2 billion, according to data compiled by Bloomberg, down from $10 billion at the same time in 2015.
Investors have good reason to be leery of CLOs. As energy prices stay low and economic growth slows globally, many companies are having more trouble paying their obligations, gutting returns on the securities. Losses in some of the instruments are more than 11 times as they are in similarly-rated junk bonds.
In other credit worries, the subprime auto consumer is now beginning to see rising problems…
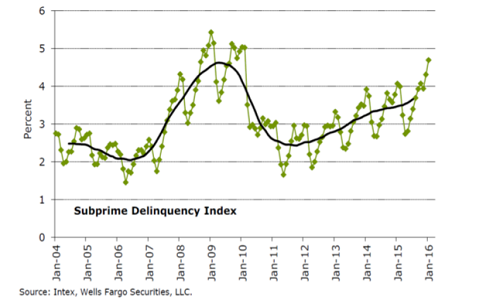
Easy credit, the high-octane fuel propelling U.S. auto sales to record heights, is beginning to show a downside as delinquencies on the securities backed by subprime auto loans have reached the highest level since 2009, Fitch Ratings reports.
“Weaker performance in the subprime sector is being driven mainly by the weaker credit quality present in the 2013 through 2015 securitized pools, along with marginally lower used vehicle values,” wrote Hylton Heard, Fitch’s senior director.
Nearly 5% — 4.98% — of subprime auto loans were delinquent by 60 days or more, the highest level since September 2009 (4.97%).
Earlier this month Experian Automotive, which tracks the new and used-car finance industry, reported that 20.8% of auto loans are now held by consumers with subprime or deep subprime credit scores — defined by FICO scores of between 300 and 620.
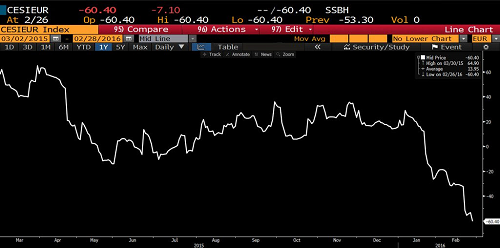
Now over to Europe where economic data continues to sour…
@AmbroseEP: Nasty fall in the Belgian business index to -6.6 in February. Always watched as leading indicator for Europe’s industrial heartland
…and at a surprising rate…
@TheStalwart: Meanwhile, the Eurozone surprise index still getting destroyed. Maybe time to start talking divergence again.
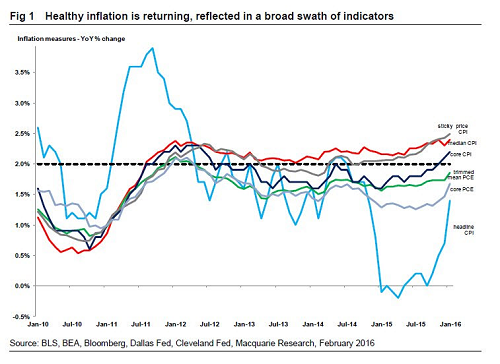
While Europe doesn’t have an inflation problem, all measures in the U.S. are curling higher…
@TheStalwart: Here’s a chart from MacQuarie showing all different kinds of inflation measures moving up.
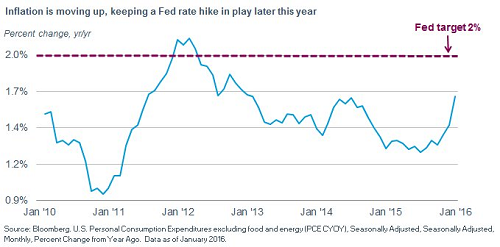
What will the Fed think of inflation? Well here is their favorite chart which was updated last week…
@KathyJones: Core #PCE has been below the #Fed’s 2% target for almost 4 yrs. Recent spike is significant. Tightening ahead?
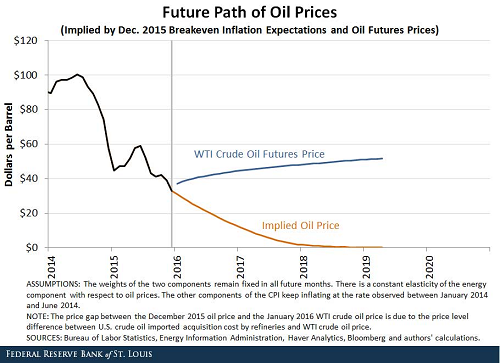
The St. Louis Fed has been dissecting Treasuries and TIPS. Either Oil falls to Zero or Inflation is going to move higher…
According to our calculations, oil prices would need to fall to $0 per barrel by mid-2019 in order to validate current inflation expectations. After that, there is no oil price that would allow our model to predict a CPI path consistent with December 2015 breakeven inflation expectations. This implied path of oil prices is very different from the path of oil prices implied by futures contracts, which rises to more than $50 per barrel by mid-2019.
While we know that the Fed would like to raise rates to get in front of inflation, the global markets continue to be a bigger worry…
“It is still early to judge the ramifications of the increased market volatility of the first seven weeks of 2016,” Fischer said in the text of a speech he’s set to deliver Tuesday in Houston.
The Fed’s No. 2 policy maker said if market developments lead to “a sustained tightening of financial conditions,” that could slow the global economy and affect growth and inflation in the U.S. “But we have seen similar periods of volatility in recent years — including in the second half of 2011 — that have left little visible imprint on the economy,” he said.
With three weeks to go before the Fed’s next policy meeting, officials are running out of time to send a credible signal to financial markets that a rate increase is still on the table. Based on pricing in federal funds futures markets, investor see about a 10 percent probability of an increase at the Federal Open Market Committee’s March 15-16 meeting in Washington.
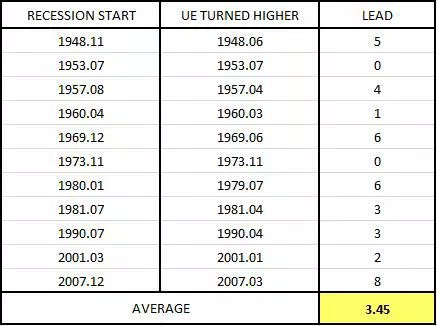
Moving from Inflation to the next Recession, just keep a close eye on the unemployment rate…
The unemployment rate is usually assumed to be a lagging indicator. But if you look closely at the chart, you will see that the trend in the unemployment rate is a coincident indicator–maybe even a leading indicator. In each of the eleven recessions that occurred since 1948, the unemployment rate turned higher a few months before the recession began.
Bill Gates has been making the rounds for his newly released Annual Letter. He is cautious short term on technology investing…
Investors need to become more discriminating when investing in start-up technology start-ups, following recent “over-enthusiasm” in Silicon Valley, according to Bill Gates.
The Microsoft co-founder said he would bet on valuations of so-called “unicorns” — the 150 or so private companies that have been valued at more than $1bn — falling over the next two years, but that venture capital remains an attractive long-term asset class in an era of ultra-low interest rates.
“There is some sorting out that is taking place,” Mr Gates said. “It never should be a case of closing your eyes and saying ‘Oh, it’s a tech company, just throw money at it’. That strategy worked for about two years; now you actually have to open your eyes and look at the company.”…
“If you gave me a basket of unicorns, I wouldn’t know right now whether to go long or short,” Mr Gates said. “I might go short in the two-year timeframe, but not in the longer timeframe because all it takes is for one or two of those to join the pantheon and your short would make you go bankrupt.”
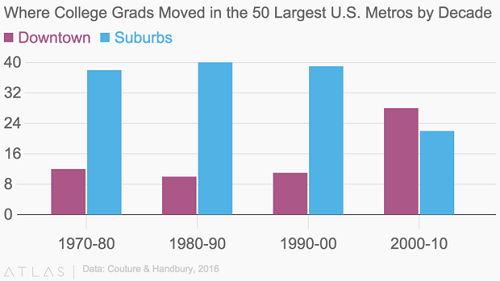
Chart of the week… The kids no longer want to live in the ‘burbs…
@HPSInsight: CHART: Moving downtown – reversal from decades of college grads’ suburbanization
Finally, a quote from Jay Leno to the many of us who will be voting in the Presidential semi finals this week…
“If God wanted us to vote, he would have given us candidates.” – Jay Leno
The information presented here is for informational purposes only, and this document is not to be construed as an offer to sell, or the solicitation of an offer to buy, securities. Some investments are not suitable for all investors, and there can be no assurance that any investment strategy will be successful. The hyperlinks included in this message provide direct access to other Internet resources, including Web sites. While we believe this information to be from reliable sources, 361 Capital is not responsible for the accuracy or content of information contained in these sites. Although we make every effort to ensure these links are accurate, up to date and relevant, we cannot take responsibility for pages maintained by external providers. The views expressed by these external providers on their own Web pages or on external sites they link to are not necessarily those of 361 Capital.
