It is Labor Day – a good time to think about jobs. Employment is the most important element in economic growth and also for future Fed decisions. Each month the employment situation report is the subject of intense discussion. It helps to understand the data.
This will be most effective if you attempt to answer each question before checking the answer. The quiz is a little wonky; if it were not, everyone would know it. If you are right on even half of these questions, you will be doing better than most of the “experts.” No peeking!
For answers where a number is called for, take credit if you are within 25% of the actual answer.
Questions
- If initial jobless claims are nearly 300K per week, and payroll employment gains are less than that per month, how can employment be getting better?
- How many new jobs are created each month?
- Is the “birth/death” model the most important method used by the BLS to account for new jobs?
- How accurate is the estimate of new job creation?
- What is the sampling error (i.e. “margin of error” defined as +/- 90%) for the monthly payroll employment report?
- How many times is the original payroll report revised?
- Do these revisions eliminate the sampling error?
- Is it more accurate to look at “internals” like job growth in a sector, than to go by the overall change in jobs?
- What is the aggregate annual impact of seasonal adjustments?
- Do Fed members and political leaders know the results in advance?
- What year was the high point in labor participation?
- What was the level?
- How many people who actually want jobs, whether or not they are looking, are currently unemployed?
- What is the duration of unemployment?
- Does the BLS have discretion in determining or announcing the monthly results?
Answers
- Initial jobless claims are a report of job losses. The payroll employment report is a net number – gains minus losses for the month. This distinction is frequently missed, even by leading economists whom you see on TV.
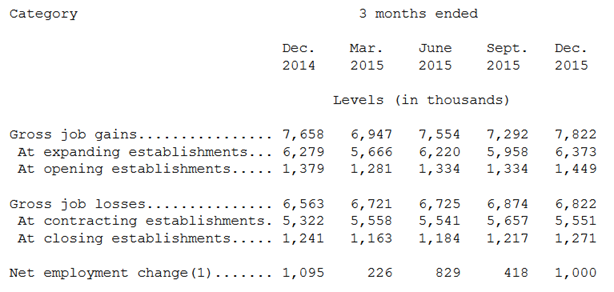
- Over 2.6 million jobs were created per month in the most recent report, Q4 2015. About 2.3 million jobs per month were lost. The net gain for the quarter was about one million, much smaller than the gross increase of 7.8 million.
- No. The BLS does not receive responses from those who have gone out of business, but it treats non-respondents like the rest of the sample. They make an assumption that enough new businesses are formed to offset those that dropped out. This is the “imputation step” which is four times as important as the birth/death adjustment.
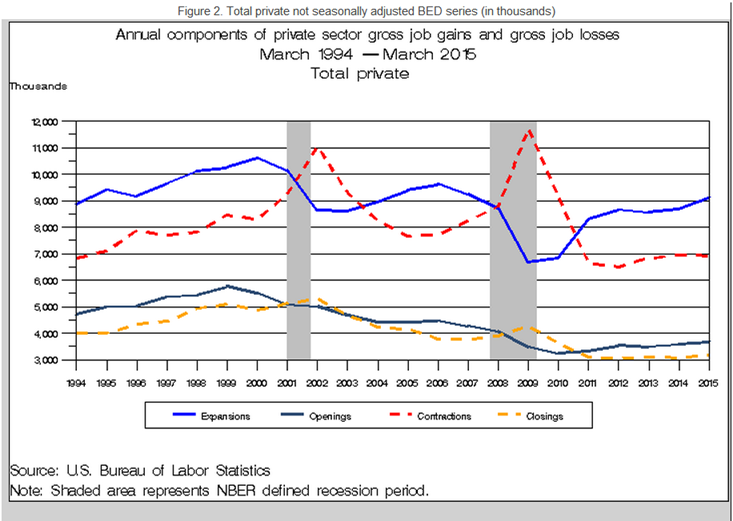
- The estimates of both overall employment and new job creation have been very good, but this still means deviations of 50K to 125K jobs each month. The chart below shows that most of the monthly variation comes from continuing businesses and is captured in the sample. Business births and deaths are largely offsetting.
- The sampling error for the net change in jobs is about +/- 100K.
- There are three revisions. The first two occur on the two months after the initial report. These reflect additional survey responses, not any sort of correction. More than a year later, the results are benchmarked to actual counts from state employment agencies. The Quarterly Census on Employment and Wages covers 98% of private employment, so this is a good count.
- The first two revisions do not eliminate sampling error. The benchmark revisions are actual counts, not a sample, but the QCEW reports are not very current.
- A lot of discussion is focused on the “internals” of the report. People never mention that each of these subgroups is part of the sample, and also subject to sampling error. Depending on the size of the group, it can be much larger (proportionally) than for the overall net job change.
- This is a trick question and the easiest of the quiz. Despite the spinning you hear each month about seasonal adjustments, they are cited only when it proves the pundit’s point. The aggregate annual effect of adjustments is zero.
- The President, Vice-President, the Council of Economic Advisors, and the Fed Chair get the report the afternoon before it is announced. It is a tightly-controlled process, with results not even known until a day or so before Jobs Day.
- The peak in labor force participation was in early 2000.
- The level was about 67%. Looking only at those aged 25-54, the level was 84%.
- The number of unemployed who want jobs and instead work part time or have become discouraged is 7.8 million, about the same as the number counted in the reported unemployment count, or over 15 million total. The oft cited much higher numbers of people “not working” include (among others) people who have retired, are still in school, or have chosen to work raising a family.
- About 2 million people, or 26% of the total, have been unemployed for 27 weeks or more.
- The employment reports are the result of a detailed process that is changed infrequently and only after great public debate. Partisan politicians are not involved in compiling the data. The language chosen is the subject of internal debate, but only covering a modest range of choices. It sounds like it is written by a committee with a limited vocabulary – and it is!
Conclusion
I hope you enjoyed the quiz. Whether or not you did well, you should now be a more discerning and skeptical consumer of jobs report punditry.


