Summary
The analysis in this post informs my new column, The Passive-Aggressive Investor, which focuses on ETF investing. Here's a link to the first installment.
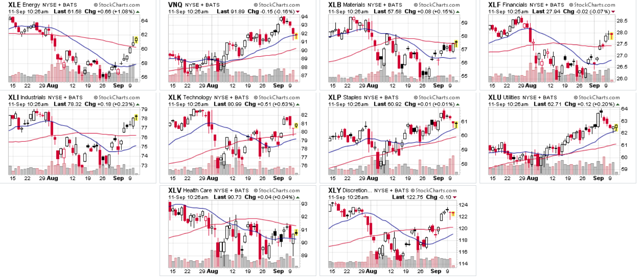
We're seeing some more bullish moves in the major sectors over the last two months:The defensive sectors have sold off modestly. Real estate (top row, second from left), staples and utilities (middle row, last two) have all sold off modestly. Healthcare (bottom left) had been trending sideways. Energy (top row, left), financials (top row, right), industrials (middle row, left) and consumer discretionary (bottom right) have all risen. Energy is up 10% -- a strong run for a sector that has underperformed for a number of years. Financials, industrials, and discretionary are 6%-7% higher. While none of these bullish sectors are setting up for a major upside breakout, they are all in short-term uptrends.
UK data shows the negative impact of Brexit. Production was down 0.5% on a rolling, 3-month basis; manufacturing was down 1.1% during the same time frame. Both were up M/M, 0.1% and 0.3% respectively. Both have trended sideways since mid-2017. GDP was flat on a rolling 3-month basis. Production and construction contracted; only services grew. GDP contracted in the previous rolling 3-months, making this the second consecutive quarter of weak growth. While unemployment remains low, the report did note that growth was "at a lower rate than in recent months." It's more than obvious that the Brexit situation is hurting overall growth.
Thoughts on the upcoming Fed meeting: There is ample support for those who want to hold rates and those who want to cut. For the former, there is low unemployment and inflation, which is more than contained. While industrial production has been a bit weaker over the last year, it hasn't cratered. And retail sales recently resumed their upward move, indicating consumers are still buying. Those who want to cut can point to weaker capital spending, softer employment readings, and downward trending global conditions. But even for the doves there isn't much supporting a cut beyond 25 basis points, largely because the coincidental US indicators are in pretty good shape.
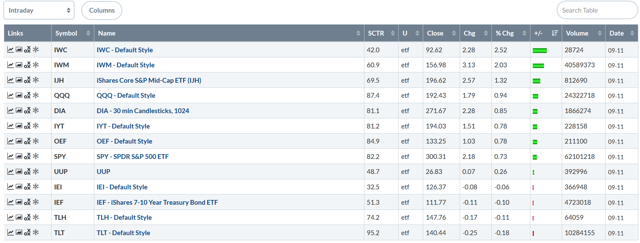
Let's turn to today's performance table:Once again, we have a solid day for small-caps, with the micro-caps gaining 2.5% and small-caps rising a little over 2%. Mid-caps gained more than 1%. This is welcome news for the bulls, as the underperformance of smaller-caps has been a fundamental problem with the Spring rally. The long end of the curve sold off fractionally.
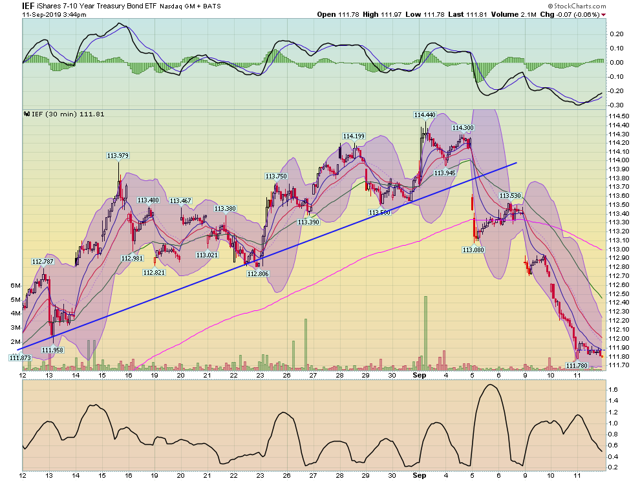
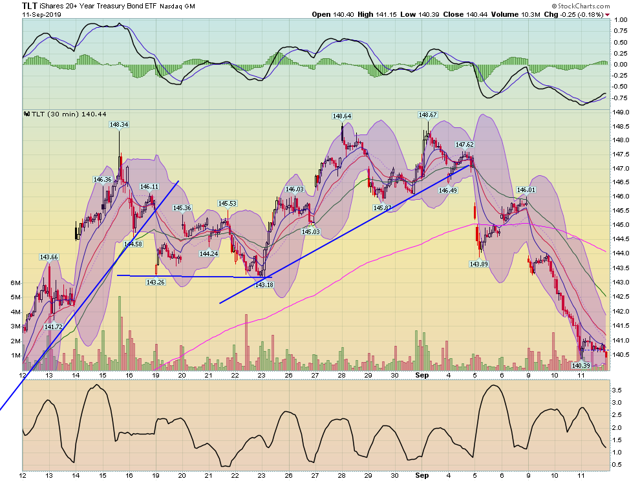
We're seeing some very solid bullish moves over the last two days. Let's start with the 30-day charts of the key Treasury market ETFs:The iShares 7-10 Year Treasury Bond (NASDAQ:IEF) was in a solid uptrend connecting lows from August 13, 23, and 30. It broke that trend on the 5th and has been heading lower since. Notice the sharpness of the selloff, indicating a strong move to take profits.The long-end of the Treasury market has also sold off strongly. Like the IEF, the TLT is near its 30-day low.
Next, let's take a look at the smaller-cap indexes' 30-day charts:
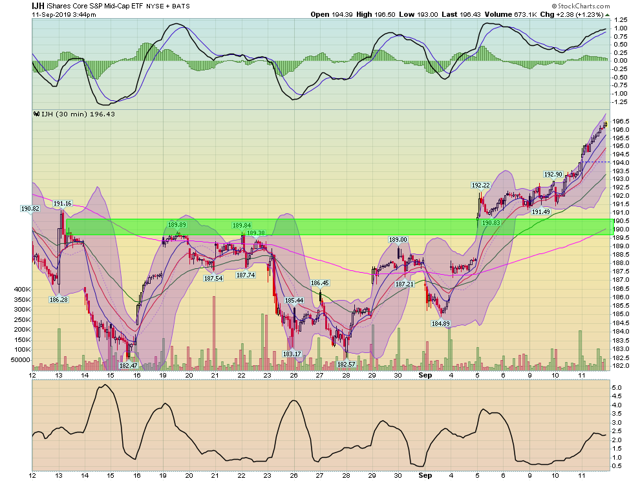
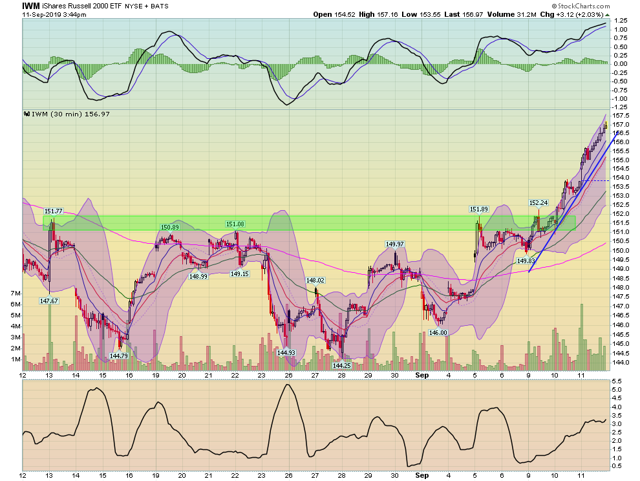
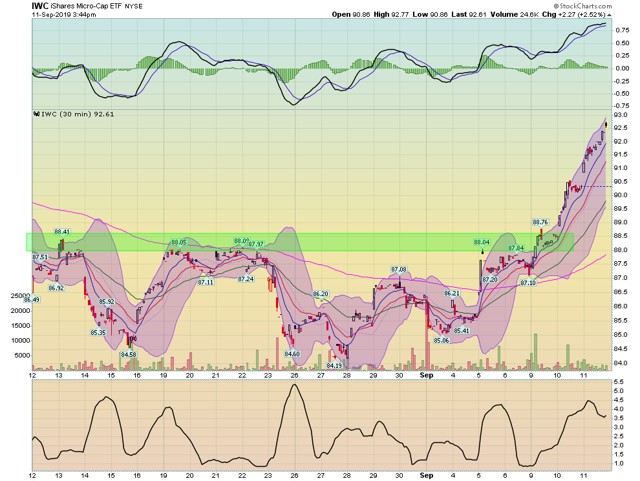
The mid-caps had strong resistance in the upper-180s. It moved through that level on September 5th and has continued to move higher since. The iShares Russell 2000 (NYSE:IWM) had resistance in the lower 150s but has since broken out.And micro-caps have made a strong advance over the last two days.
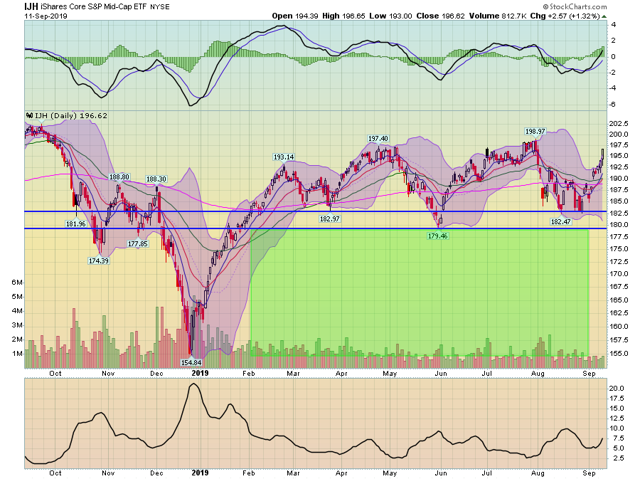
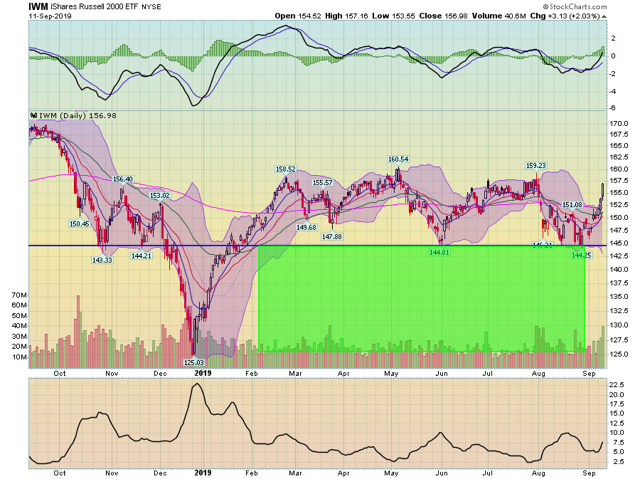
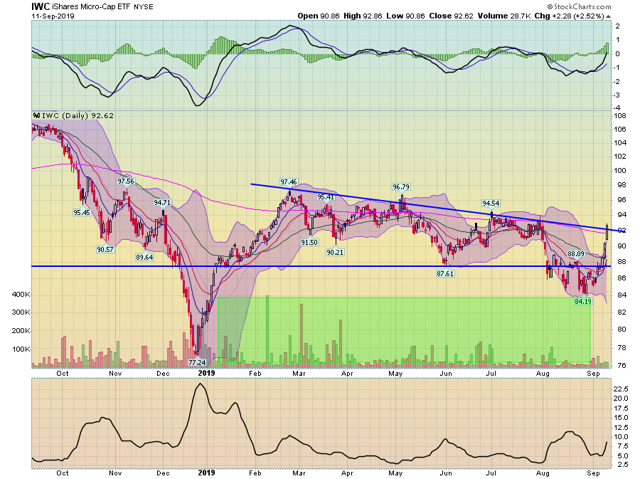
Finally, let's look at the daily charts of the small-cap indexes, starting with the mid-caps:The iShares S&P Midcap 400 (NYSE:IJH) printed a very strong bar today and is quickly approaching the upper 190s, which have provided resistance since April.Small-caps have printed two consecutive strong bars on very strong volume. The upper-150s is the next area of resistance.This chart should really excite the bulls. Micro-caps have moved through the downward sloping trend line connecting highs all the way back to February. Prices are also above the 200-day EMA.
The strength in the small-cap indexes is very important development for the bulls. Assuming this trend remains intact for a bit longer, it might be possible to argue for a broader rally -- at least for technical reasons.
