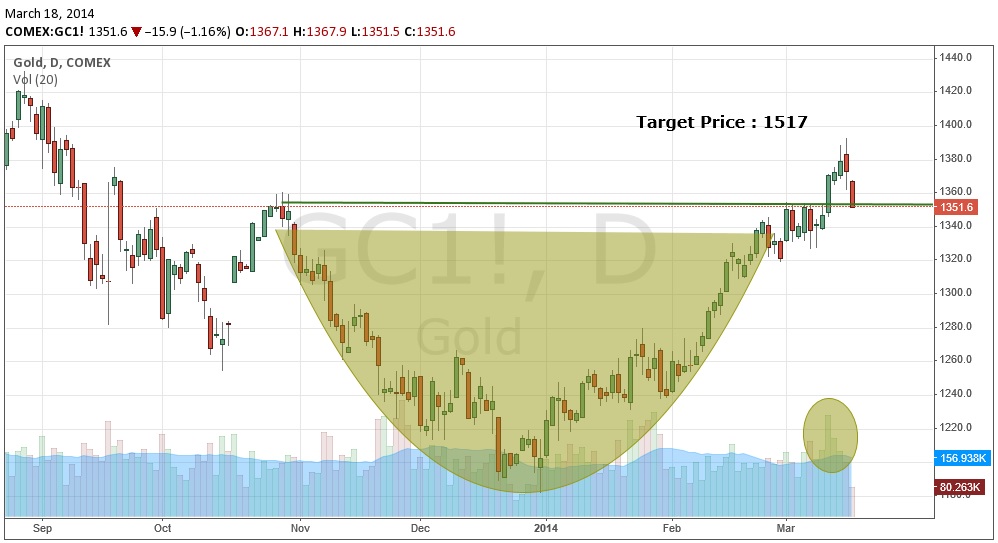
Gold is staging a breakout of a powerful technical pattern that will bring $1500/oz. into reach.
Buying pressure has been building for physical gold. Price action is reflecting stronger bullish sentiment and a continuation of the long term bull trend, which dates back to 2009. Technical indicators show that gold is now poised for another strong move to the upside.
We know that gold trades differently than other commodities and differently than stocks. Some successful investors, such as Warren Buffet, steer clear of gold because it’s value cannot be easily calculated by some discounted cash flow or other quantitative method. The price of gold reflects investor sentiment and investor expectations for future economic conditions. The price of gold reflects inflation expectations, future global economic conditions and political tensions. When investors get nervous, gold provides reliable refuge.
Technical analysis is very effective for making predictions for the price of gold. That’s because investor sentiment is the main driver in the gold market. Supply and demand are slower moving operators on the price of gold. Investor sentiment on gold can be mercurial at times, but the patterns of investor behavior in the gold market are well established. Patterns repeat, which is why technical analysis works.
Price action in spot gold has produced a bullish cup-and-handle pattern. This is a powerful bullish chart pattern that dates back to November 2013. The cup-and-handle pattern is formed when price action carves out a gradual, deep cup, returning to the “lip” trend line, followed by sideways to slightly declining “handle” portion. The depth of the cup portion defines the measured move. Breakout is a close above the lip trend line as some time after the handle is formed. A spike in volume at breakout confirms the validity of the pattern.
We can see the cup-and- handle pattern is well defined for COMEX spot gold on the daily basis chart. The lip trend line is 1353. The breakout, accompanied by a spike in volume, occurred on March 12th. The measured move is 164, which brings a target price of 1517 for the pattern.
A
fter breakout, price action continued to climb, until today. During the overnight and early morning hours, gold dropped back down to the trend line. If gold closes below the trend line today, then the pattern will have failed. It is not uncommon, however, for price to find support at the trend line, then resume in breakout fashion.
We will be watching gold closely over the next several trading sessions. We are long COMEX gold in our Model Conservative Portfolio. We have been long gold for a while now. We expect gold to move higher from here.
Disclosure: Responsible citizens and prudent investors protect themselves and their wealth against the ambitions of over-reaching government authority and debasement of the currency by owning gold. Gold is honest money. Investors from around the world benefit from timely market analysis on gold and silver and portfolio recommendations contained in The Gold Speculator investment newsletter, which is based on the principles of free markets, private property, sound money and Austrian School economics.
The question for you to consider is how are you going to protect yourself from the vagaries of the fiat money and economic uncertainty? We publish The Gold Speculator to help people make better decisions about their money. Our Model Conservative Portfolio has outperformed the DJIA and the S&P 500 by more than 3:1 over the last several years. Follow @TheGoldSpec Subscribe at our web site www.thegoldspeculatorllc.com with credit card or PayPal ($300/yr) or by sending your check for $290 ($10 cash discount) The Gold Speculator, 614 Nashua St. #142 Milford, NH 03055.
