In anticipation of the publication of GDP data and the Bank of England meeting
The British pound has been recently trading in a narrow range after a 12% sharp decline as a result of the victory of supporters of the country's exit from the European Union in a referendum of June 23, 2016. The main reason for the collapse of the pound was the fear that the Bank of England will expand the program of economic stimulus. Its next meeting will take place on August 4, 2016. Will the British currency strengthen if the Bank of England retains the main parameters of monetary policy?
Last week, two representatives of the Bank of England announced that there is no need to hurry with the rate cut, as political uncertainty after Brexit may lead to slower economic growth.
In this regard, we deem that preliminary GDP data for the second quarter of the current year, which will be released on July 27, 2016, will have particular importance. According to forecasts, its growth will remain at the level of the first quarter and will be 2%. Note that the Bank of England current rate is 0,5%, which is much higher than similar indicators of the Fed, the ECB and the Bank of Japan. The decline of the pound was very rapid and it renewed a 30 - year minimum. Theoretically, the pound may be undervalued, as investors had little time for accurate macroeconomic estimates. In addition, the process of the UK exit from the EU may take much more time than it was expected immediately after the referendum.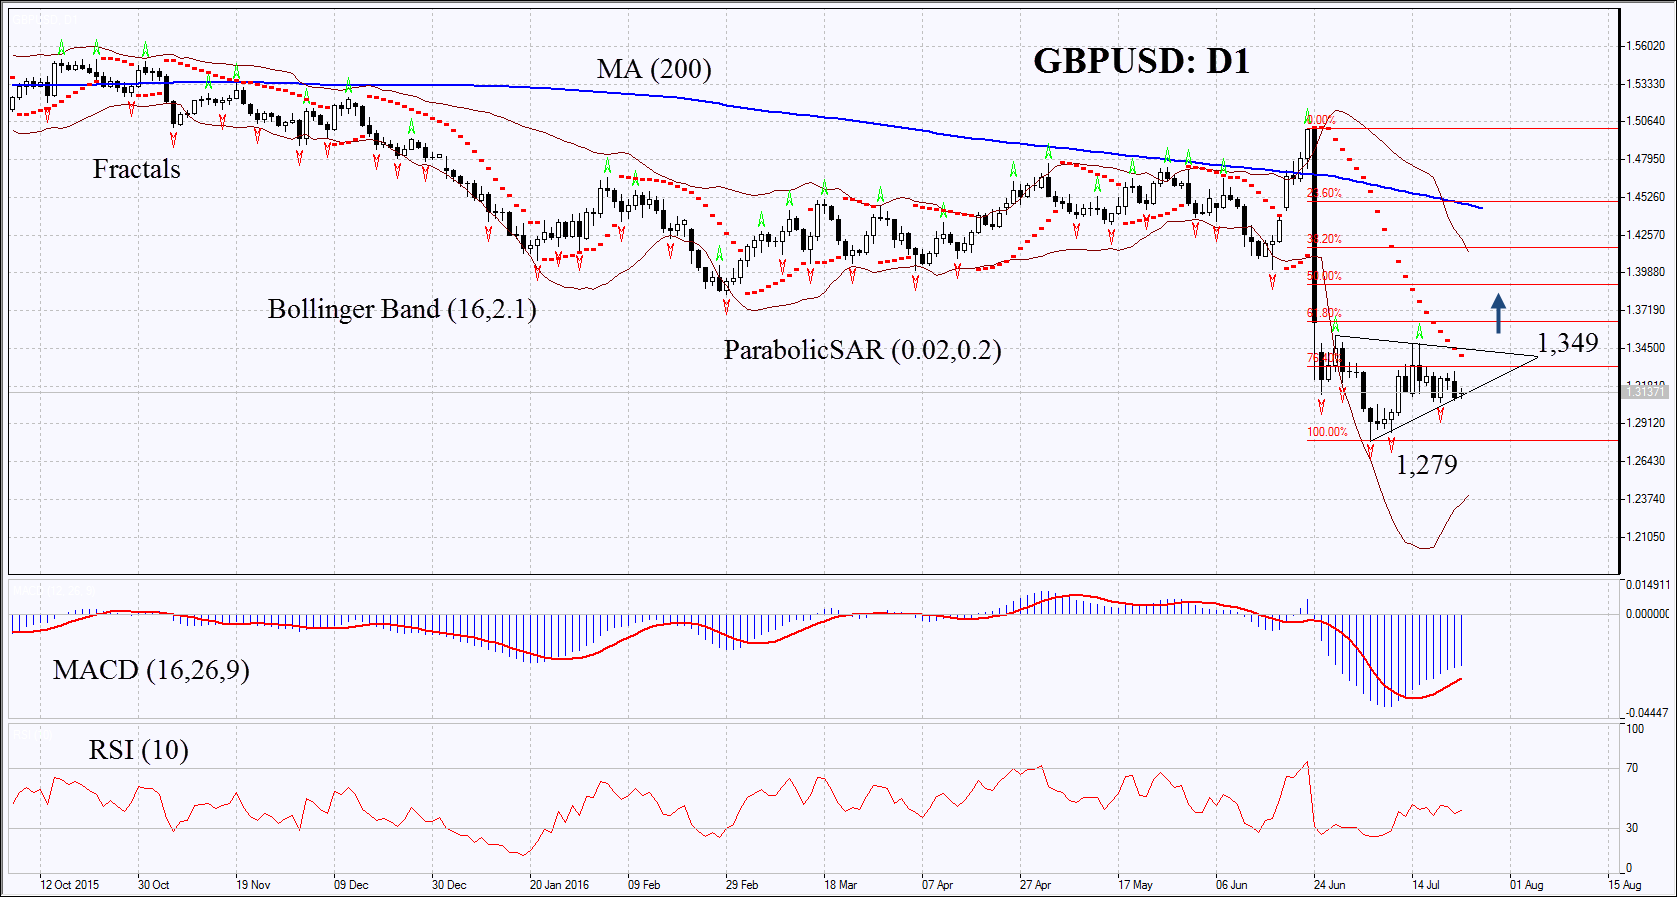
On the daily chart GBPUSD: D1 The price has stopped the downtrend on D1 and is moving sideways trying to breach upward from the triangle. The MACD indicator has formed the signal to buy. The Parabolic indicator still indicates sale, but its signal may serve as an additional level of resistance that must be overcome. The Bollinger bands have widen significantly which means high volatility. The RSI indicator is neutral and below 50. No divergence. The bullish momentum may develop in case the British pound exceeds the last fractal high, the upper boundary of the triangle and Parabolic signal at 1,349. This level may serve as a point of entry. The initial stop-loss may be placed below the recently renewed minimum since the mid-80s of the last century at 1, 279. After opening the pending order we shall move the stop to the next fractal low following the Bollinger and Parabolic signals. Thus, we are changing the probable profit/loss ratio to the breakeven point. The most risk-averse traders may switch to the 4-hour chart after the trade and place there a stop-loss moving it in the direction of the trade. If the price meets the stop-loss level at 1, 279 without reaching the order at 1,349, we recommend cancelling the position: the market sustains internal changes which were not taken into account.
PositionSaleBuy stopabove 1,349Stop lossbelow 1,279
- English (UK)
- English (India)
- English (Canada)
- English (Australia)
- English (South Africa)
- English (Philippines)
- English (Nigeria)
- Deutsch
- Español (España)
- Español (México)
- Français
- Italiano
- Nederlands
- Português (Portugal)
- Polski
- Português (Brasil)
- Русский
- Türkçe
- العربية
- Ελληνικά
- Svenska
- Suomi
- עברית
- 日本語
- 한국어
- 简体中文
- 繁體中文
- Bahasa Indonesia
- Bahasa Melayu
- ไทย
- Tiếng Việt
- हिंदी
Technical Analysis GBPUSD : 2016-07-26
Published 07/26/2016, 10:16 AM
Updated 12/18/2019, 06:45 AM
Technical Analysis GBPUSD : 2016-07-26

IFC Markets
3rd party Ad. Not an offer or recommendation by Investing.com. See disclosure here or
remove ads
.
Latest comments
Install Our App
Risk Disclosure: Trading in financial instruments and/or cryptocurrencies involves high risks including the risk of losing some, or all, of your investment amount, and may not be suitable for all investors. Prices of cryptocurrencies are extremely volatile and may be affected by external factors such as financial, regulatory or political events. Trading on margin increases the financial risks.
Before deciding to trade in financial instrument or cryptocurrencies you should be fully informed of the risks and costs associated with trading the financial markets, carefully consider your investment objectives, level of experience, and risk appetite, and seek professional advice where needed.
Fusion Media would like to remind you that the data contained in this website is not necessarily real-time nor accurate. The data and prices on the website are not necessarily provided by any market or exchange, but may be provided by market makers, and so prices may not be accurate and may differ from the actual price at any given market, meaning prices are indicative and not appropriate for trading purposes. Fusion Media and any provider of the data contained in this website will not accept liability for any loss or damage as a result of your trading, or your reliance on the information contained within this website.
It is prohibited to use, store, reproduce, display, modify, transmit or distribute the data contained in this website without the explicit prior written permission of Fusion Media and/or the data provider. All intellectual property rights are reserved by the providers and/or the exchange providing the data contained in this website.
Fusion Media may be compensated by the advertisers that appear on the website, based on your interaction with the advertisements or advertisers.
© 2007-2024 - Fusion Media Limited. All Rights Reserved.