
India reduced exports
In India, beef exports contracted by volume by 13.2% to 598.9 thousand tons in April-September 2015, compared to the same period of the previous year, after tougher cattle slaughtering standards were introduced. The export contracted by value by 15.5% to $1.89bn. Will the reduction of beef export from India provoke the global price increase?
This year the Indian People’s Party took over the leadership of Maharashtra state and prohibited there the sale and consumption of beef. The Party is planning to extend the restriction over the whole territory of India where the cows are sacred animals. Meanwhile, the country is the major global beef exporter. During the last few days, the cattle prices are falling after the World Health Organization said beef consumption can provoke cancerous diseases. It is hard to say yet what can influence more the prices, the cutting of India’s exports or the news that beef causes health problems. According to USDA, the number of feeder cows in the U.S. in August hit the low since 1996 amounting to 1.9mln units. In one year, the number reduced by 6%. Meanwhile, the beef export from the U.S. decreased 12% this year compared to the same period of last year, while imports rose 17%. The United States are the net-importer of this meat. The export is forecasted to reach 2.3bn pounds this year with import forecasted to be at 3.4bn pounds. On October 28, the US Department of Agriculture will publish the report “Livestock & Meat Domestic Data” and on November 5 the “Livestock & Meat International Trade Data” report. They are likely to influence the beef prices.
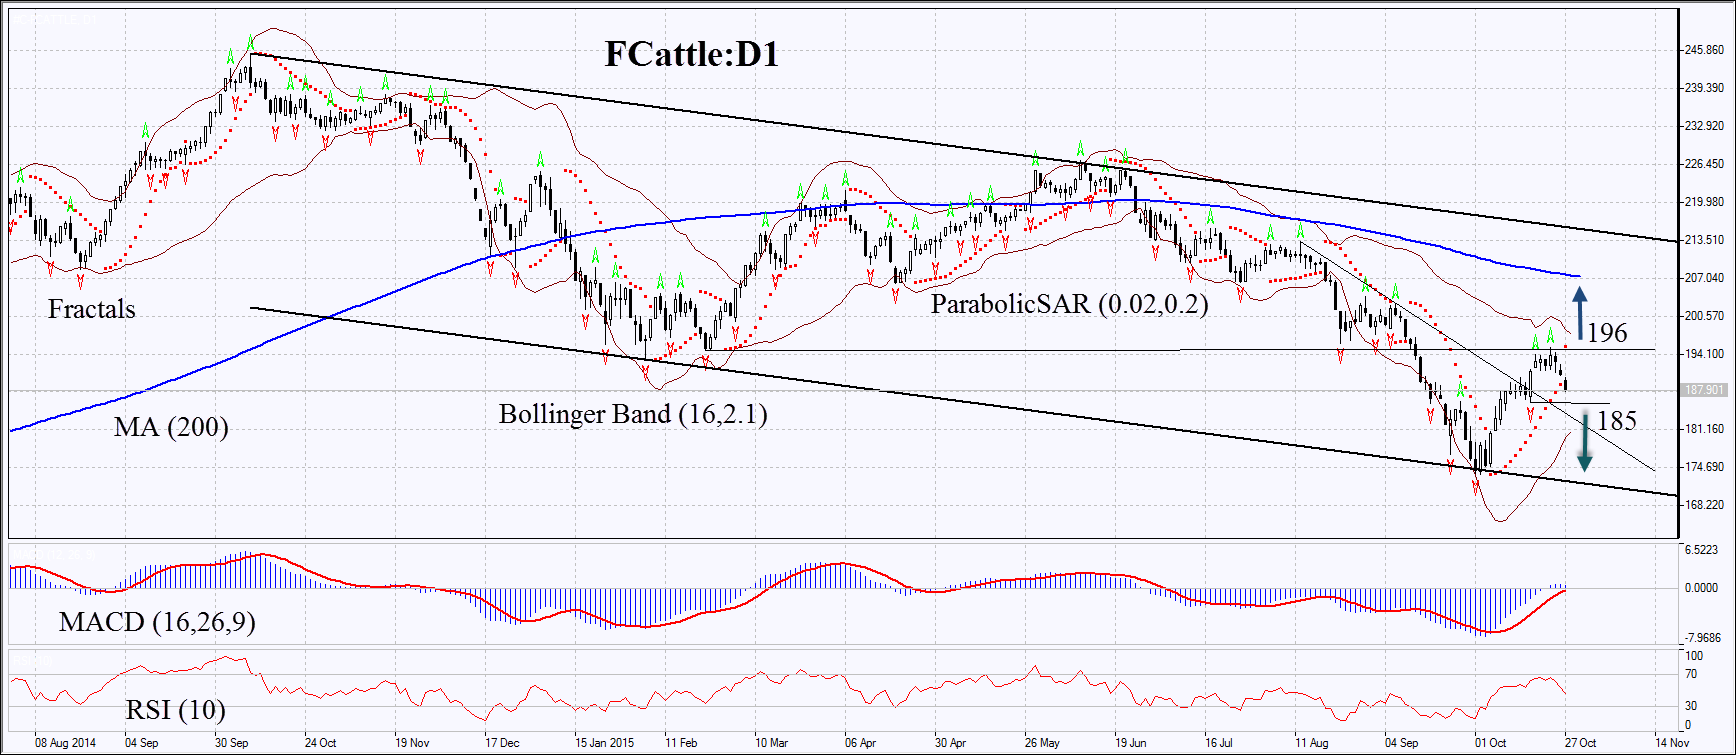
On the daily chart, the PCI FCattle:D1 is being neutral. The Parabolic indicator has formed the sell signal. MACD yet gives the buy signal. RSI is neutral and below 50. The Bollinger Bands® are contracting, which can signify the lower volatility. In our opinion, the momentum can develop after growing and surpassing two last fractal highs and Parabolic signal at 196 or in case of falling below the fractal low at 185. Let the market choose the direction. Two or more positions can be opened symmetrically: having opened one of the orders, the second one can be deleted as the market has chosen the direction. Having opened the pending order, we shall move the stop to the next fractal high (short position) or fractal low (long position) following the Parabolic signal every 4 hours. The most risk-averse traders may switch to the 4-hour chart after the trade and place there a stop-loss moving it in the direction of the trade. Thus, we are changing the probable profit/loss ratio to the breakeven point. If the price meets the stop-loss level without reaching the order, we recommend canceling the position: the market sustains internal changes which were not taken into account.
Position Sell Sell stop below 185 Stop loss above 196
Position Buy Buy stop above 196 Stop loss below 185