Get 40% Off
👀 👁 🧿 All eyes on Biogen, up +4,56% after posting earnings. Our AI picked it in March 2024.
Which stocks will surge next?
Unlock AI-picked Stocks

Tadawul All Share Index: Failed Bullish Pattern

Published 08/19/2016, 04:38 AM
Updated 07/09/2023, 06:32 AM

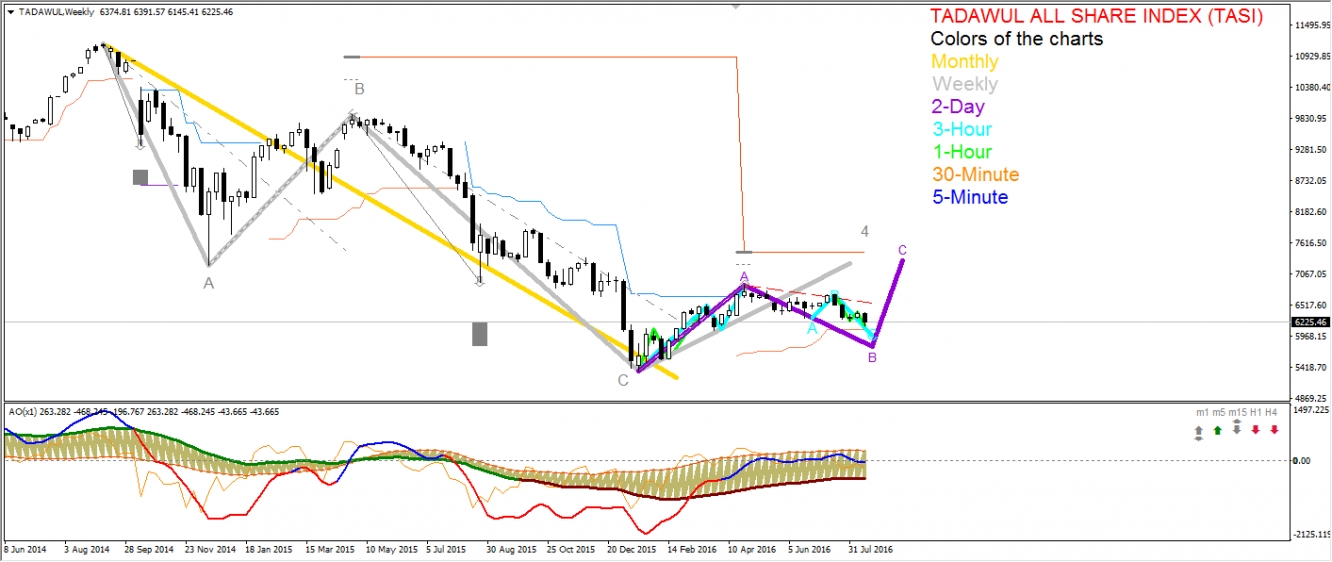
Weekly Chart
Tadawul All Share on weekly is performing a bullish correction that could be treated as either a subwave inside the grey C bearish wave or a probable 4th correction wave. This recovery has a narrow power to turn into an impulse as the current high on the Awesome Indicator could not surpass its previous high reached by the weekly B correction wave last spring.

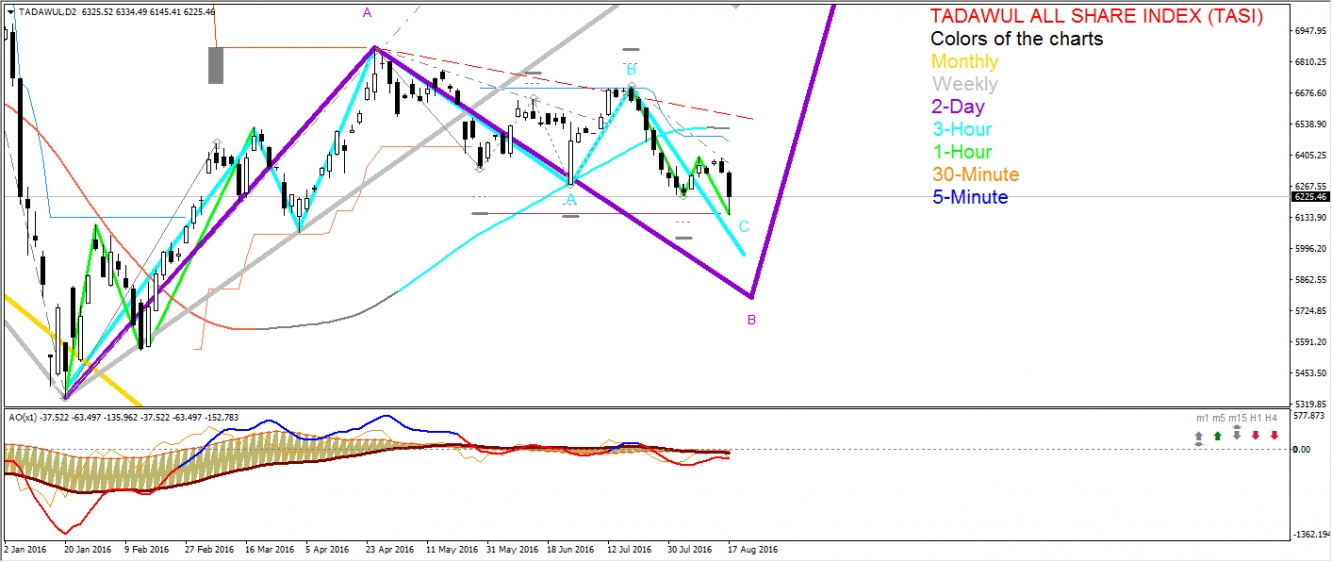
2-Day Chart
In my previous articles I have been writing that the 16-hour chart shows a complex B correction wave. However, both the impulse A wave and the current B correction wave got out very prolonged. Therefore, this wave structure could be considered on an older time frame. I think we face a forming 3-wave structure on a 2-day chart. I modified my marking accordingly: violet lines match 2-day waves. The current B correction wave seems to be quite adequate for the previous bullish A wave. So if TASI will not start to build the bullish 3rd wave on a 2-day chart soon, we will have to reassign a new status for this complex bearish correction wave by examining it on older time frames.

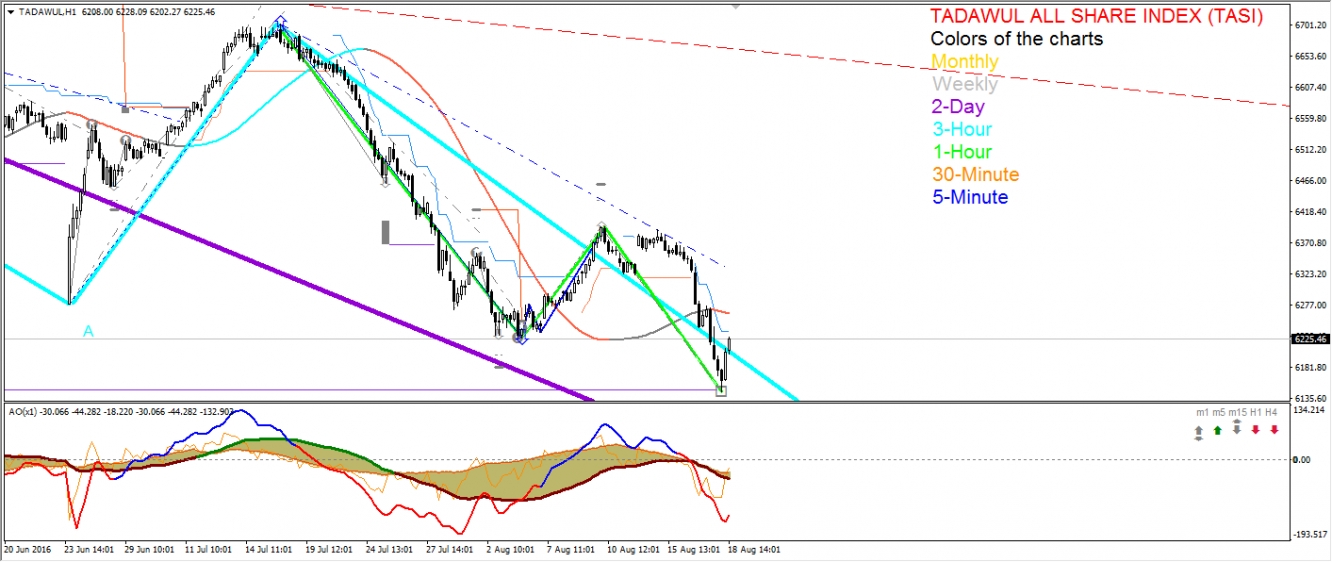
1-Hour Chart
The bullish pattern expected on August 17th on a 30-minute chart failed by another bearish subwave extension on the older 1-hour time frame.

Tadawul All Share Index (TASI) Weekly ChartTadawul All Share Index (TASI) 2-Day Chart

Tadawul All Share Index (TASI) 1-Hour Chart

Latest comments

Risk Disclosure: Trading in financial instruments and/or cryptocurrencies involves high risks including the risk of losing some, or all, of your investment amount, and may not be suitable for all investors. Prices of cryptocurrencies are extremely volatile and may be affected by external factors such as financial, regulatory or political events. Trading on margin increases the financial risks.
Before deciding to trade in financial instrument or cryptocurrencies you should be fully informed of the risks and costs associated with trading the financial markets, carefully consider your investment objectives, level of experience, and risk appetite, and seek professional advice where needed.
Fusion Media would like to remind you that the data contained in this website is not necessarily real-time nor accurate. The data and prices on the website are not necessarily provided by any market or exchange, but may be provided by market makers, and so prices may not be accurate and may differ from the actual price at any given market, meaning prices are indicative and not appropriate for trading purposes. Fusion Media and any provider of the data contained in this website will not accept liability for any loss or damage as a result of your trading, or your reliance on the information contained within this website.
It is prohibited to use, store, reproduce, display, modify, transmit or distribute the data contained in this website without the explicit prior written permission of Fusion Media and/or the data provider. All intellectual property rights are reserved by the providers and/or the exchange providing the data contained in this website.
Fusion Media may be compensated by the advertisers that appear on the website, based on your interaction with the advertisements or advertisers.
© 2007-2024 - Fusion Media Limited. All Rights Reserved.