Join +750K new investors every month who copy stock picks from billionaire's portfoliosSign Up Free

Stocks Drop As Netflix Sinks

Published 04/21/2021, 12:12 AM
Updated 09/20/2023, 06:34 AM
US500
-
BA
-
IBM
-
NFLX
-
XBI
-
ROKU
-

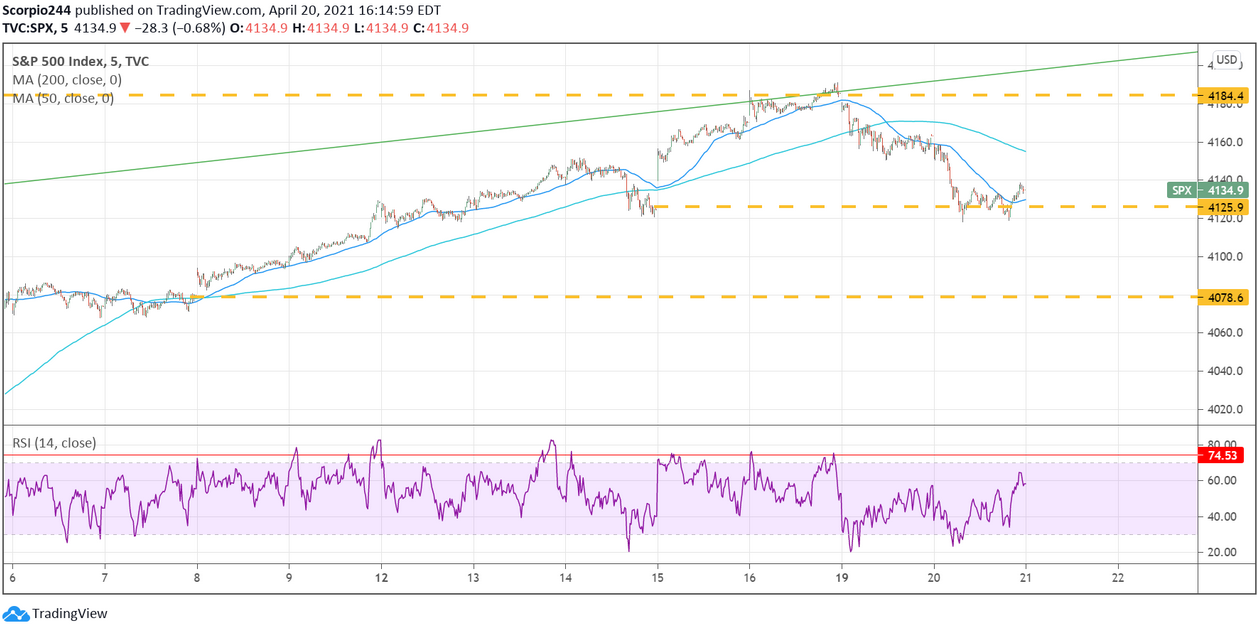
Stocks fell for a second day on Tuesday, with the S&P 500 dropping by 70 bps, nothing too exciting. The only thing established yesterday is some good support around the 4,125, which was anticipated.

There is still a gap at 4,080 that needs to be closed, and with Netflix (NASDAQ:NFLX) dropping last night, we could see that get filled later today. I still think we head towards 3,960 over the next few weeks.
S&P 500 Index Chart

Biotech

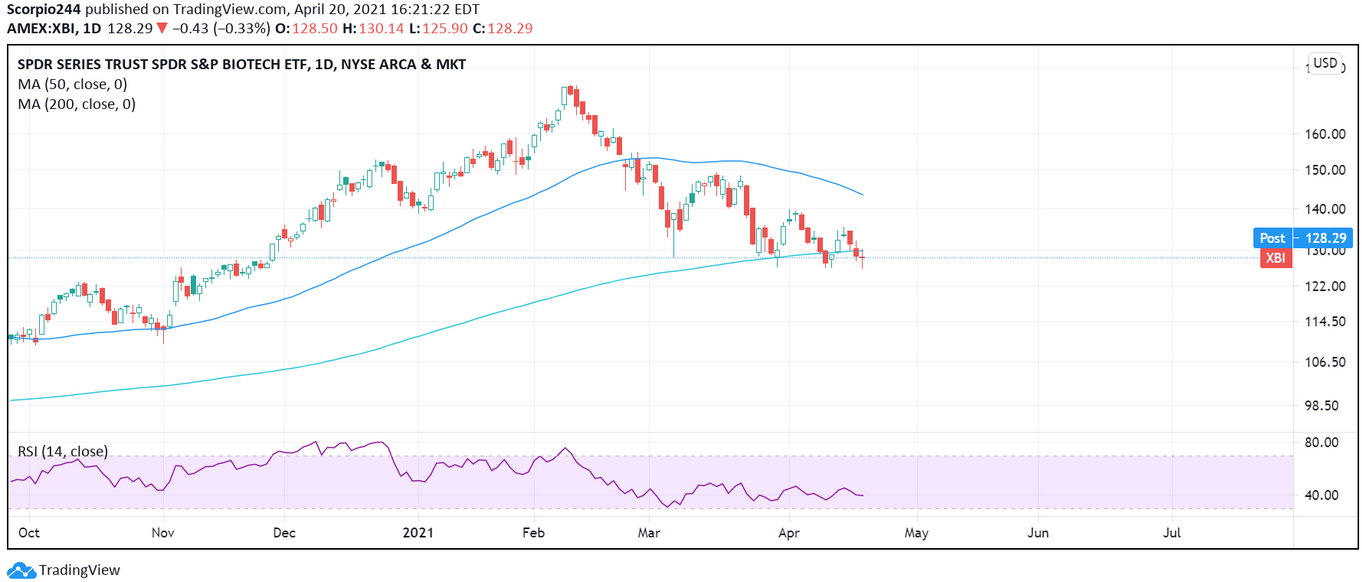
Well, I wasn’t sure what kept the SPDR® S&P Biotech ETF (NYSE:XBI) from falling below $126.85,but I figured it out. That is where the 200-day moving average rests. The XBI already broke its 50-day moving, and a break of the 200-day would be terrible.

I am wondering if the XBI already broke the 200-day, and now it is acting as resistance. It sure looks like it could be. It doesn’t look good overall, and I wouldn’t be surprised to see it drop to $114.
XBI Daily Chart

Netflix

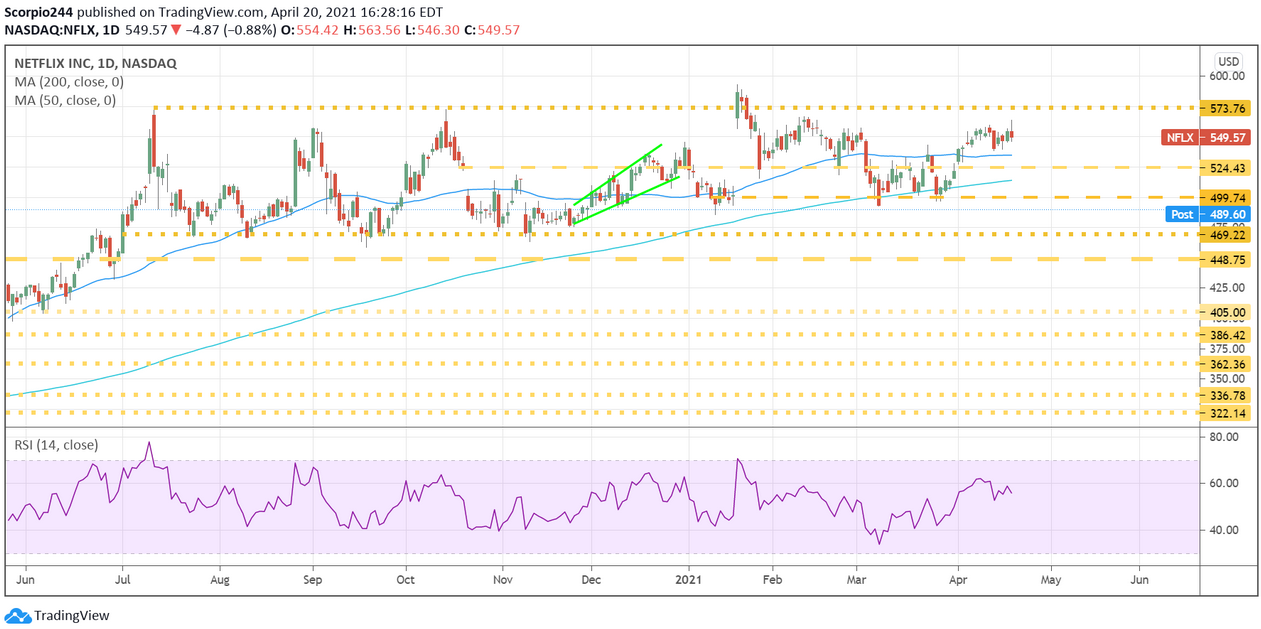
Netflix (NASDAQ:NFLX) is falling below $500 in the after hour. It missed net adds for the first quarter and guidance for the second quarter. Not a good sign. Clearly, the “re-opening” effects are happening sooner, not to mention they raised prices.

I don’t think I have ever seen them guide a quarter to just 1 million net adds. That means there may even be a risk net adds, turning to net losses in the second quarter, which will likely cross people’s minds, especially after the company missed guidance by around 2 million subscribers in the first quarter.

The price around $490 now becomes resistance with support at $470. The stock has tested $470 many times, and I think these results could put that in play.
Netflix Inc Daily Chart

Roku

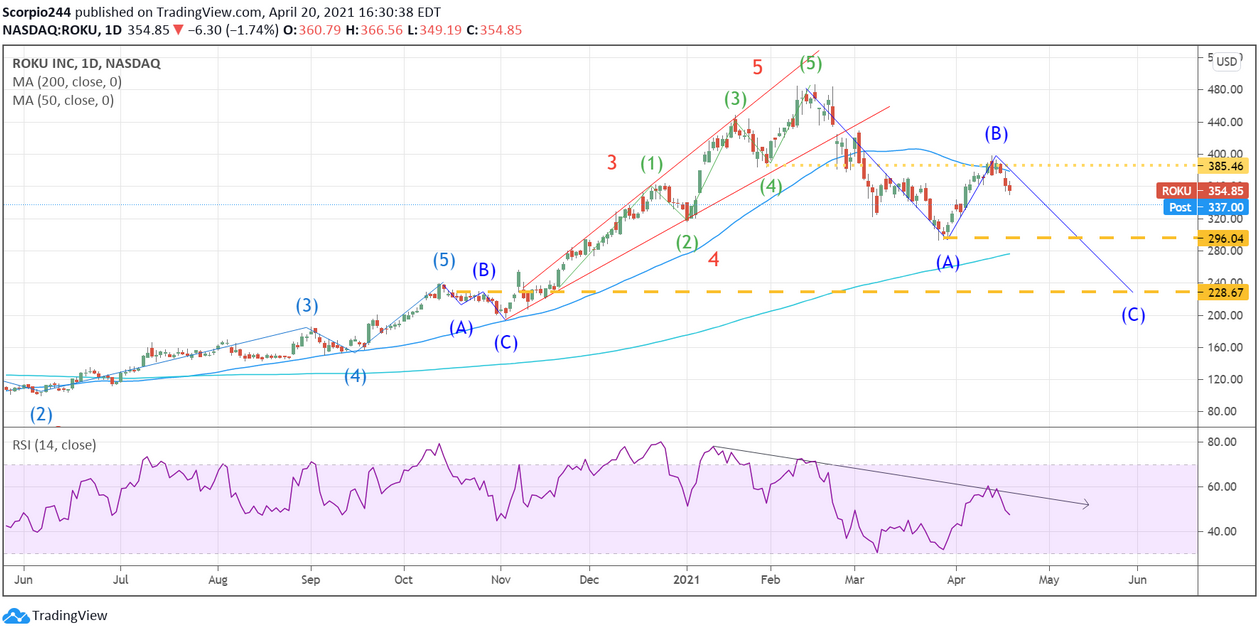
Roku (NASDAQ:ROKU) is trading lower following the Netflix news, as it should. The next level to watch there is around $300.
Roku Inc Daily Chart

IBM

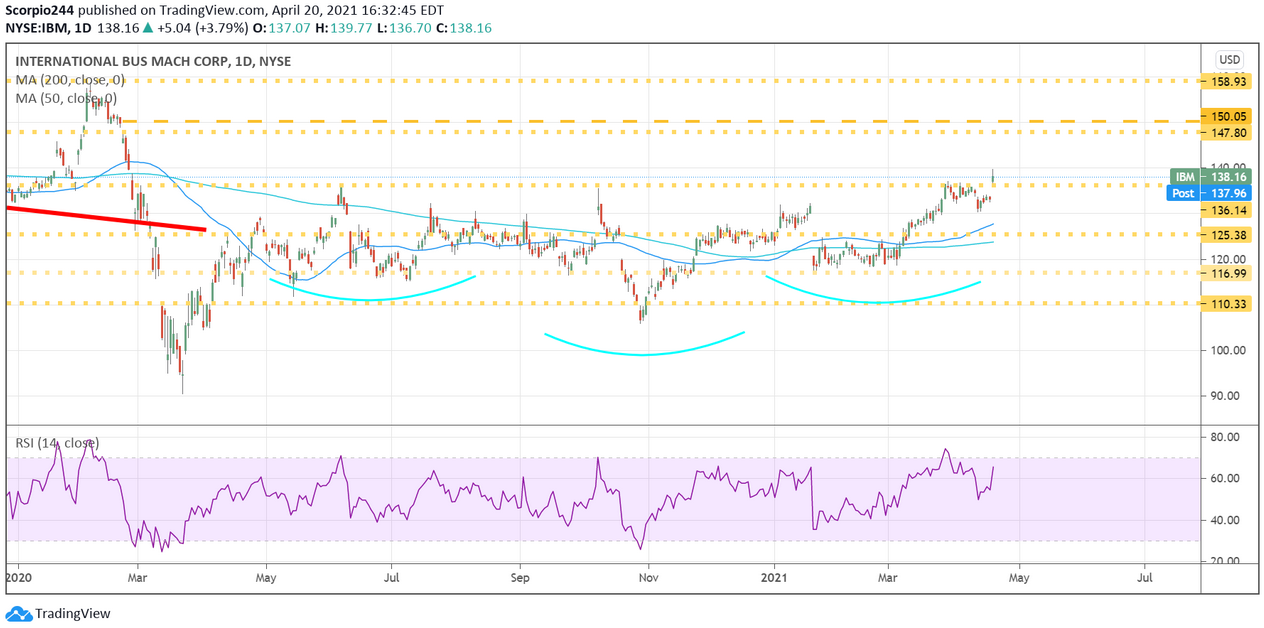
Not only did International Business Machines (NYSE:IBM) break out yesterday and rise above resistance at $136, it gapped over resistance. Maybe even a breakaway gap.

That could be good news and pave the way for a push to $148.
IBM Daily Chart

Boeing

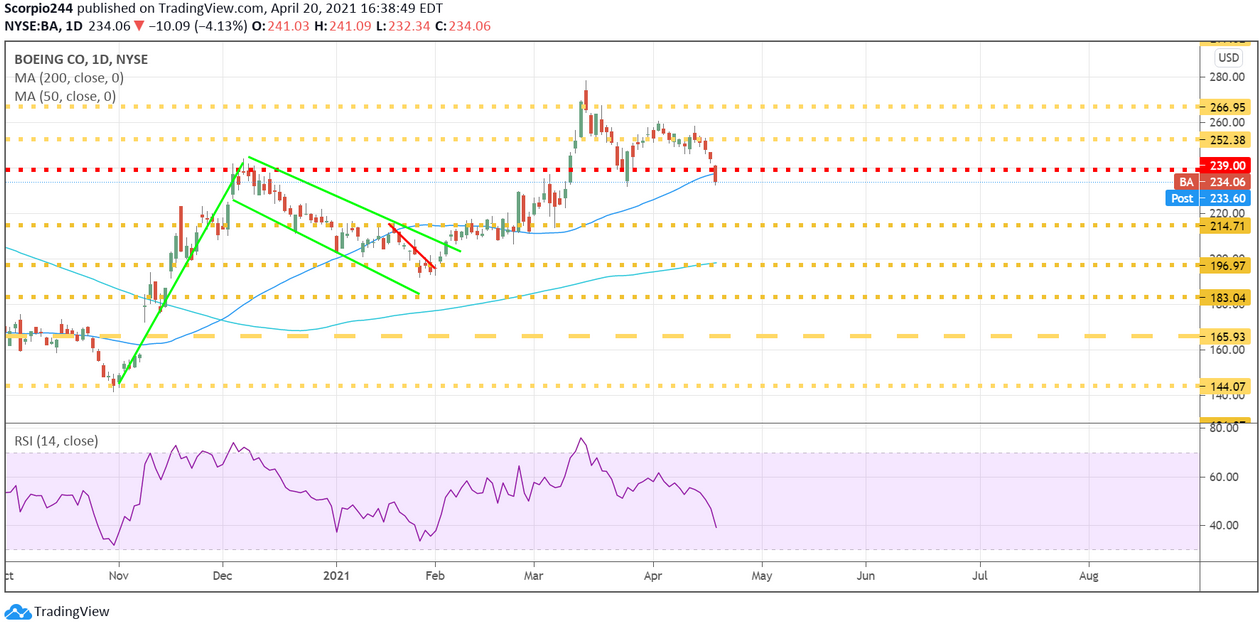
Boeing (NYSE:BA) fell about 4% on Tuesday. The stock broke below support at $239, making it possible for the stock to fall back to $215.
Boeing Daily Chart

Original Post

Latest comments

Loading next article…
Risk Disclosure: Trading in financial instruments and/or cryptocurrencies involves high risks including the risk of losing some, or all, of your investment amount, and may not be suitable for all investors. Prices of cryptocurrencies are extremely volatile and may be affected by external factors such as financial, regulatory or political events. Trading on margin increases the financial risks.
Before deciding to trade in financial instrument or cryptocurrencies you should be fully informed of the risks and costs associated with trading the financial markets, carefully consider your investment objectives, level of experience, and risk appetite, and seek professional advice where needed.
Fusion Media would like to remind you that the data contained in this website is not necessarily real-time nor accurate. The data and prices on the website are not necessarily provided by any market or exchange, but may be provided by market makers, and so prices may not be accurate and may differ from the actual price at any given market, meaning prices are indicative and not appropriate for trading purposes. Fusion Media and any provider of the data contained in this website will not accept liability for any loss or damage as a result of your trading, or your reliance on the information contained within this website.
It is prohibited to use, store, reproduce, display, modify, transmit or distribute the data contained in this website without the explicit prior written permission of Fusion Media and/or the data provider. All intellectual property rights are reserved by the providers and/or the exchange providing the data contained in this website.
Fusion Media may be compensated by the advertisers that appear on the website, based on your interaction with the advertisements or advertisers.
© 2007-2024 - Fusion Media Limited. All Rights Reserved.