It seems that the market is feeling a little bit better these last few days since the significant “inversion” last week. Has anything changed since any point last week? Certainly not in a meaningful way. So why are stocks suddenly feeling a little bit less fearful? Well, because the yield curve steepened by ten basis points or so since Wednesday, with the 10-2 year rising to around ten basis points intraday on August 19. Wow.
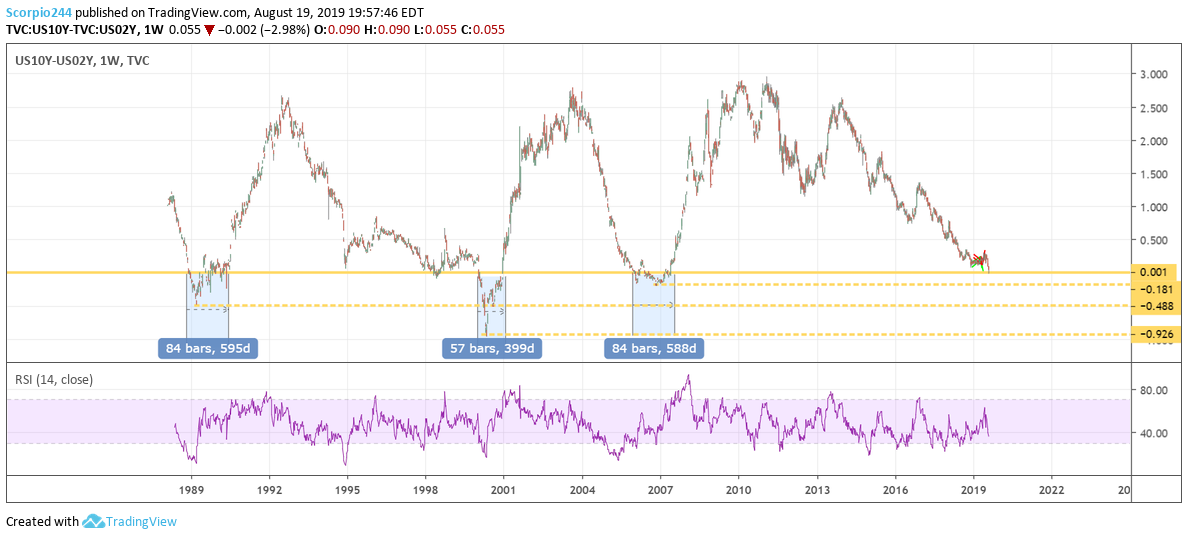
Again, I have said over and over again, the yield-curve inversion is meaningless at this point. Inversion for one second on some random day is not a recession trigger or signal. If the yield curve were inverted by about 25 to 50bps for the next six months, I’d be more concerned. But for 10 seconds? It means nothing. Look, the proof is right in front of you.
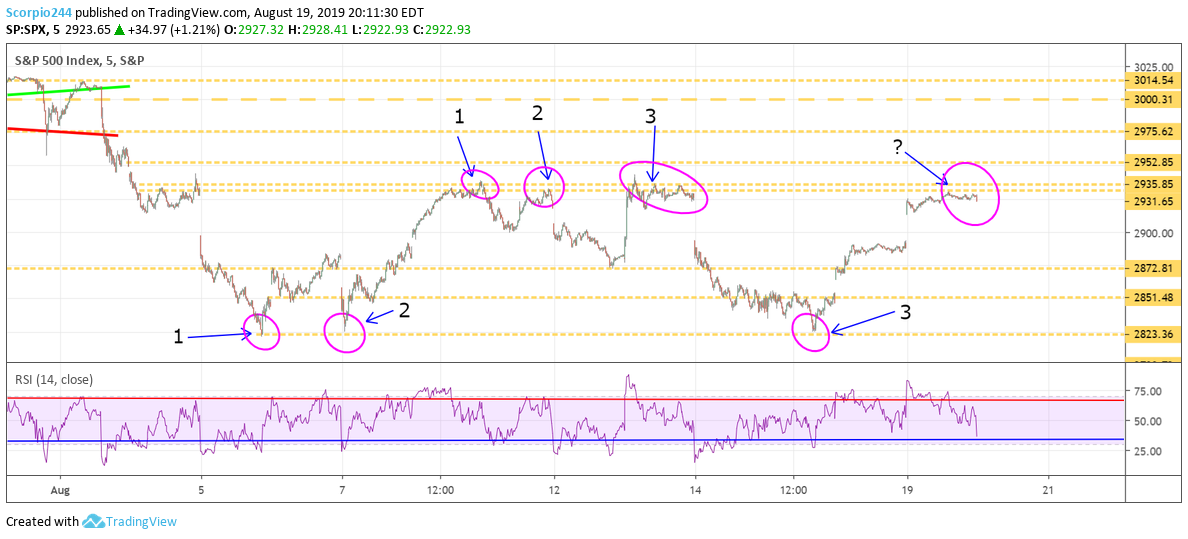
Anyway, the S&P 500 rose to around 2,925 and was stuck there. It sets up what may be a massive make-or-break moment for the equity market tomorrow. The index rose to a high of 2,931 and is closing in on a break out, which could send it back to its all-time highs.
The S&P 500 appears to have formed a triple bottom, a bullish reversal pattern. That is when a stock or index falls to a level of technical support on three occasions and doesn’t continue to decline, leading to a reversal higher. In this case, that support level was at 2,825.
To add an exciting twist. The index has already formed a triple top, after three successive attempts to rise above 2,935. A triple top is the mirror image of a triple bottom and is a bearish reversal pattern.
I haven’t seen this scenario many times in the past unfold like this. But given that index has already failed at 2,935, and has managed to reverse off of support at 2,825, I believe that the index will rise above resistance this time at the 2,935 level, and move higher back toward its all-time highs of around 3,025.
It is a bold call, I know. So that is why failure at 2,935 would be a terrible sign, and I would be anxious that support at 2,825 on the next move lower would not hold, and result in a retest of the June lows.
That is how important this make-or-break moment is for stocks.
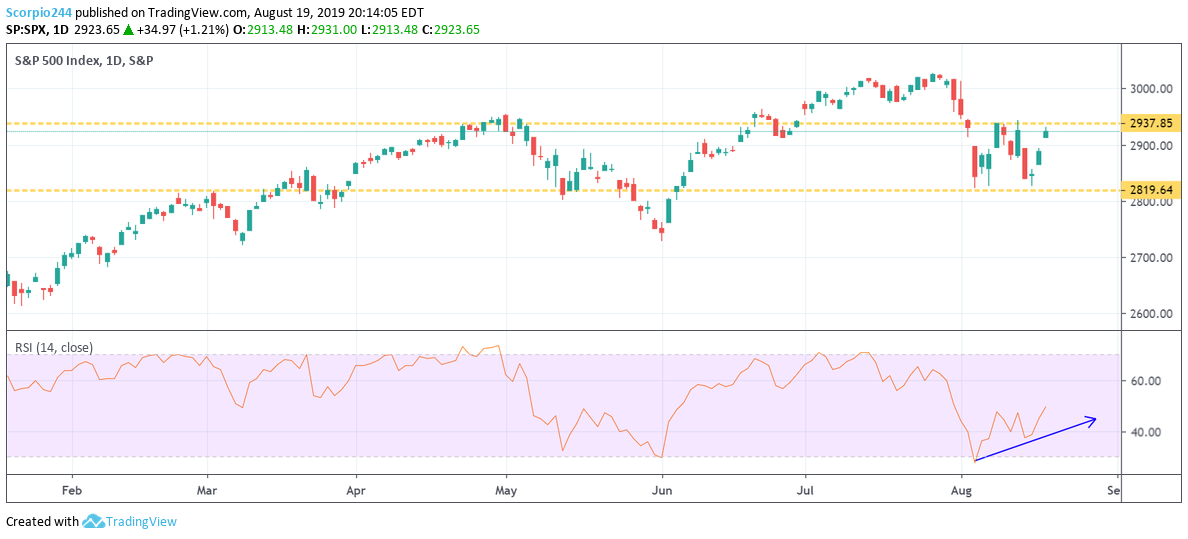
Another reason I am optimistic is the S&P 500 can head back its highs is that the relative strength index has been trending higher after hitting oversold levels on August 5, falling below 30.
VIX (VIX)
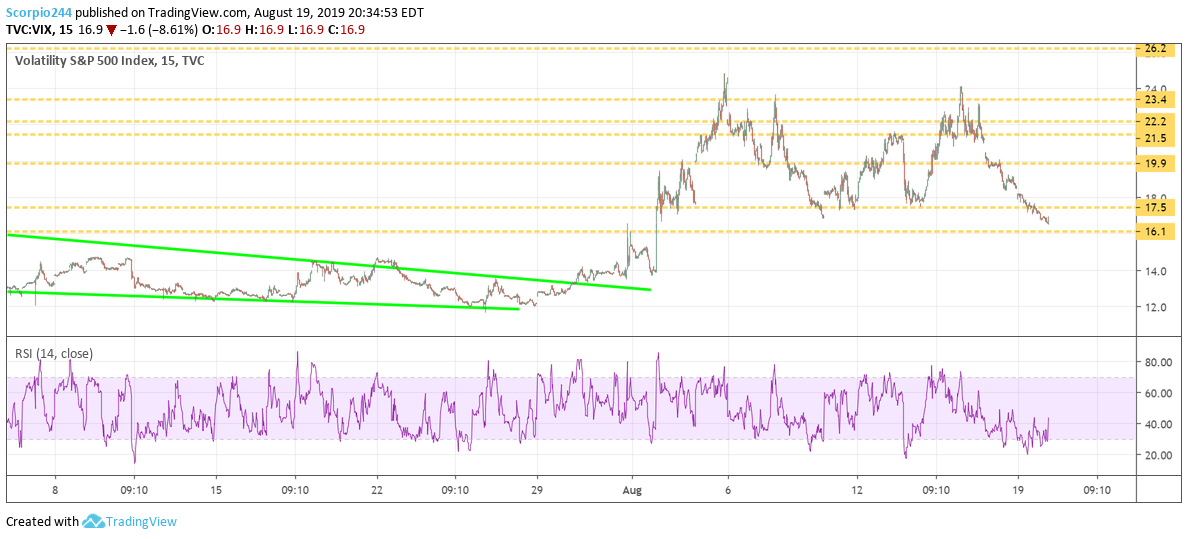
The VIX also serves as a bullish sign for the equity market. It appears to have formed a bearish reversal double top pattern and has now fallen below support at 17.5. The VIX should continue to drop, and that should push equities higher, as investors once again begin to short-volatility and go long the S&P 500.
Netflix (NASDAQ:NFLX)
Netflix (NASDAQ:NFLX) had a good day, and I noted today in a write-up for subscribers that I saw some bullish betting in the stock. Technically the stock looks strong too, and it could be on a path toward $321.
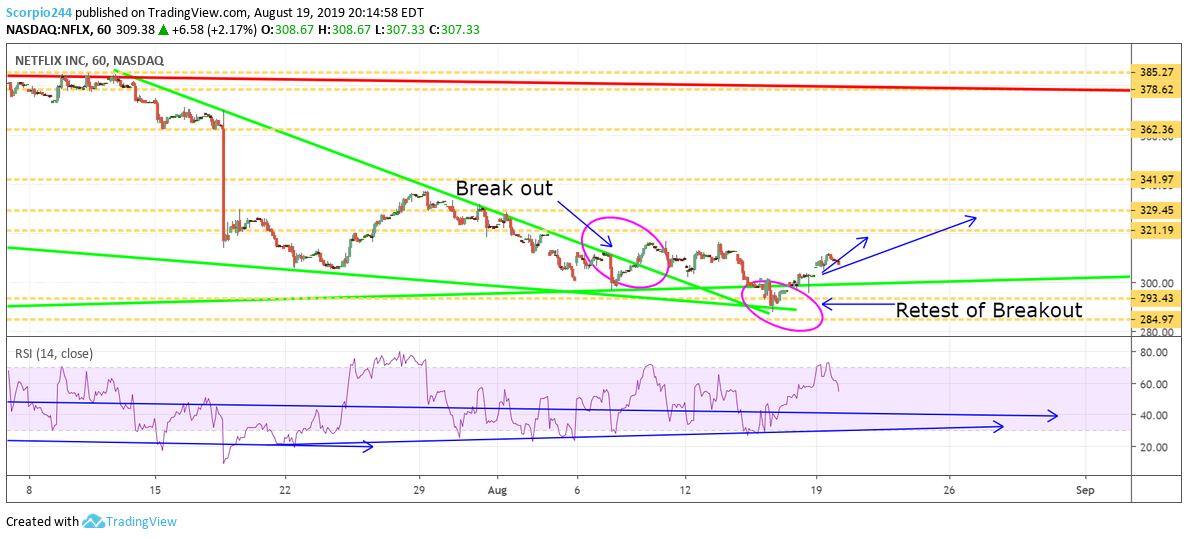
BTW, I saw the news about Apple (NASDAQ:AAPL) and its content plans of spending $6 billion. I think it is a non-event for NFLX. I do. There will be plenty of money to go around as people cut out their cable bundles. Which is why I own NFLX, Walt Disney Company (NYSE:DIS), and AAPL. The losers will the cable providers.
Apple (NASDAQ:AAPL)
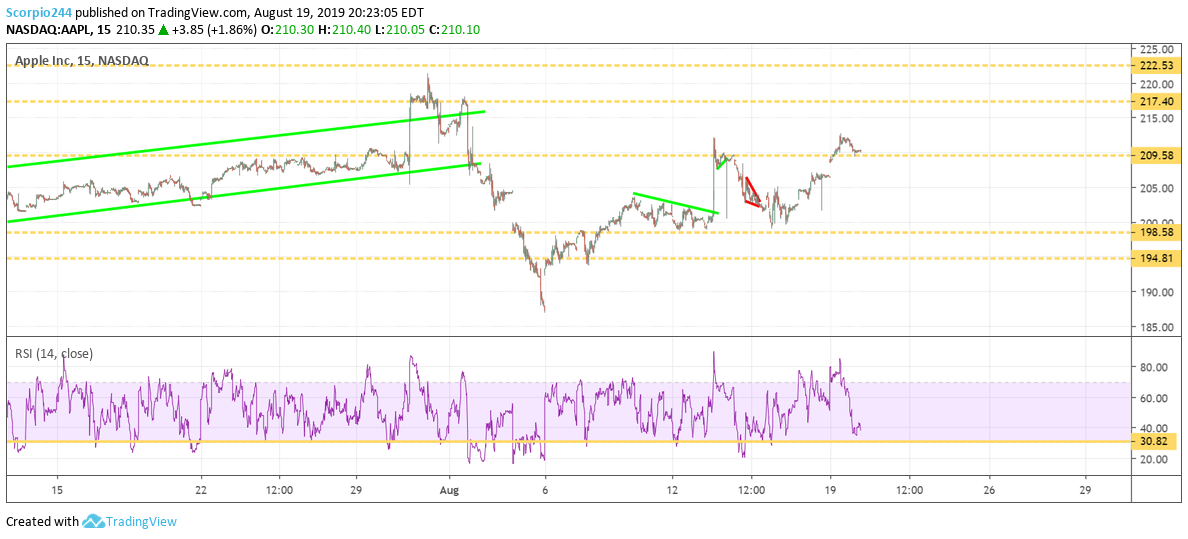
Speaking of AAPL, the stock is breaking out rising above resistance at $209.50 and could be on its way to around $217.
Nvidia (NASDAQ:NVDA)
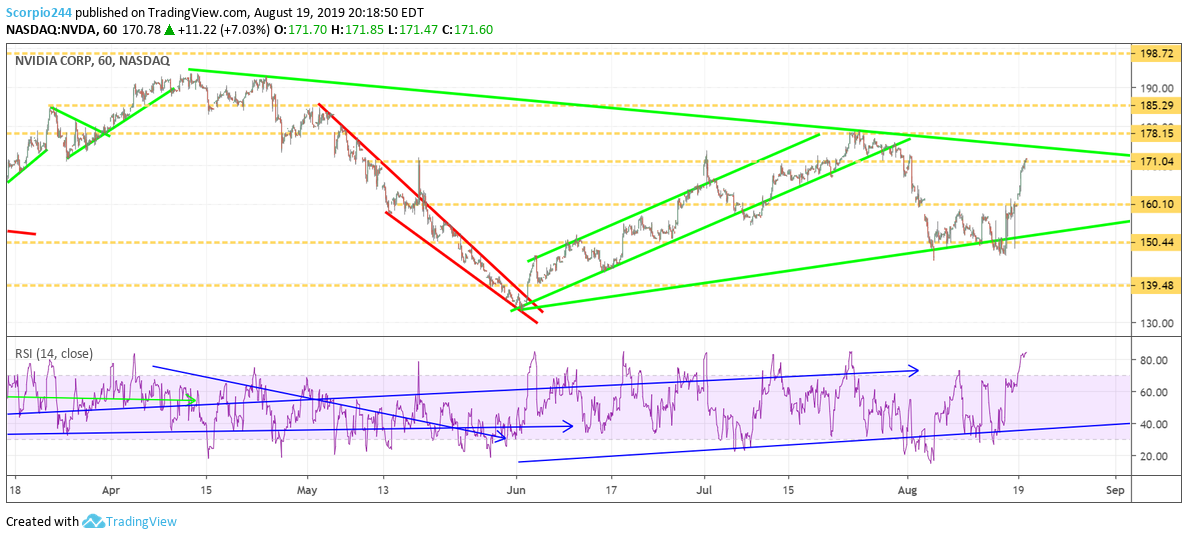
Nvidia also had a good day, rising above resistance $171, I think the stock has a little more to climb from here, maybe to around $175 to $180.
GE (NYSE:GE)
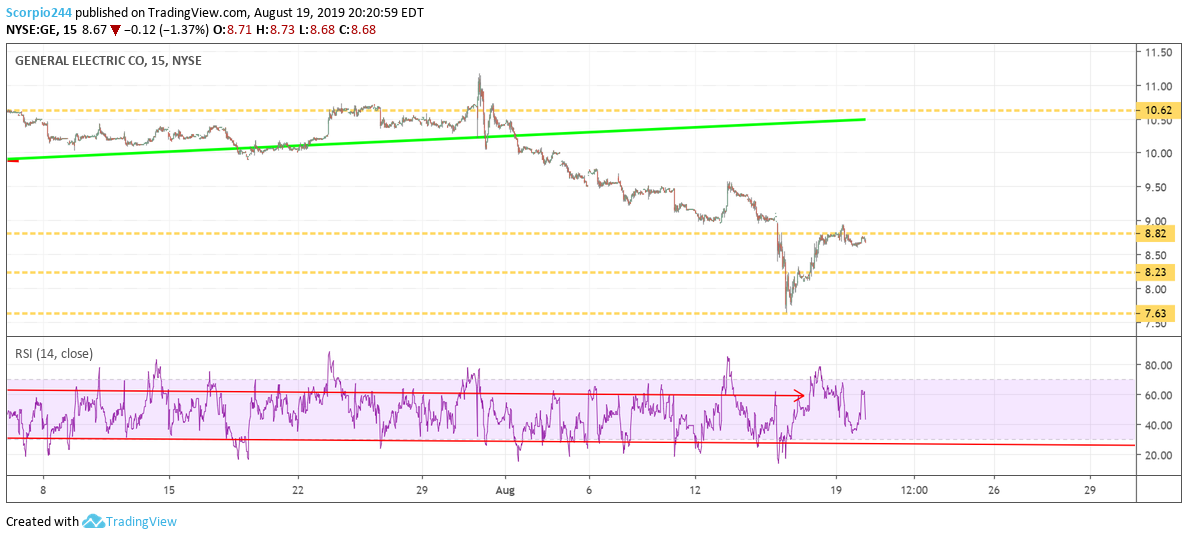
GE is having a tough time at resistance around $8.80, and I saw a bunch of bearish option betting in this one on Friday. GE: More Bearish Bets Piling On
Alphabet (NASDAQ:GOOGL)
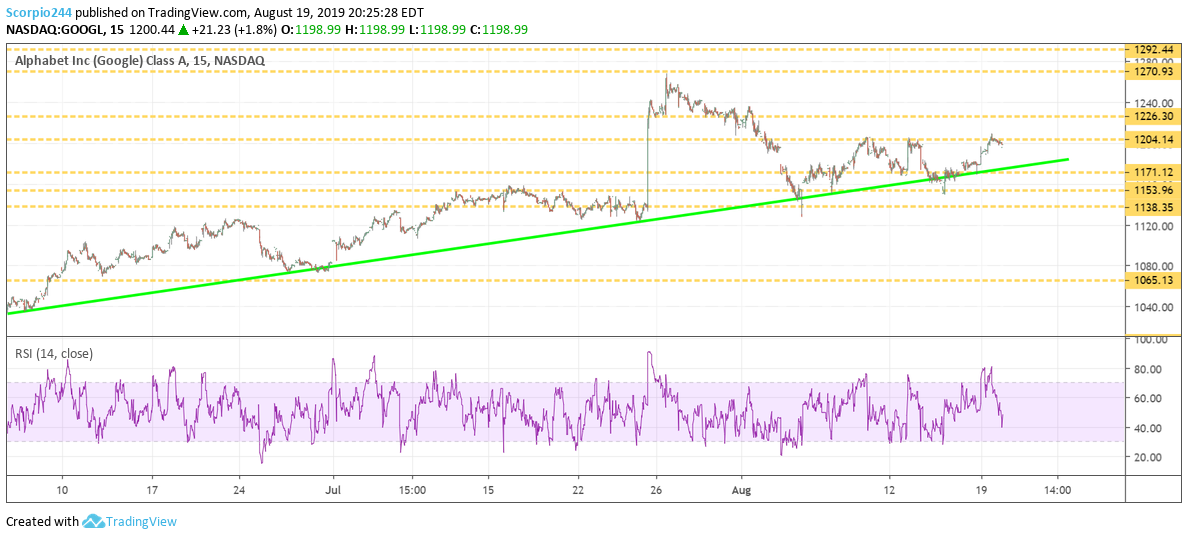
Alphabet (NASDAQ:GOOGL) is testing resistance at $1205, and I think it breaks out and heads toward $1225 and toward its highs.
