Markets: 3 out of 4 indexes fell this week, but the Russell small caps actually had an up week. Stocks traded in their tightest weekly range in 21 years, due to mixed economic data. Friday’s strong Non-Farm Payrolls Report stirred investor fears about a Fed rate hike coming in September, rather than December, as many market analysts have predicted.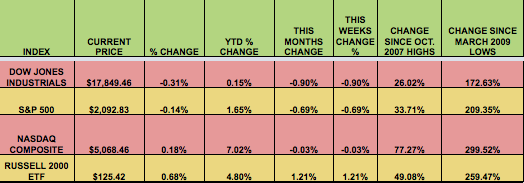
Market Breadth: 6 DOW stocks rose this week, vs. 5 last week. 38% of S&P 500 stocks rose this week, vs. 21% last week.
Currency: It was a mixed week for the US dollar, which fell vs. the euro, loonie, and Swiss franc, while rising vs. the Aussie, New Zealand dollar, and yen.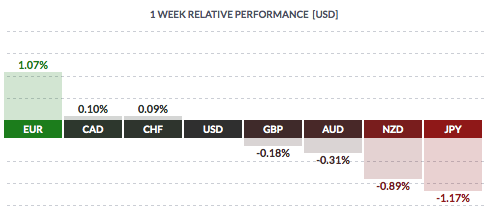
US Economic News: May Non-Farm Payrolls surprised to the upside, and April and March’s figure was revised upwards by 32,000. The 6-month average is now 236,000 jobs/month. Job gains occurred in professional and business services, leisure and hospitality, and healthcare. Mining employment continued to decline. The Unemployment Report inched up to 5.5%, due to a rise in the labor force. Wages rose by 2.3%, the best since 2009. Auto and truck sales also surprised to the upside, and are on the best pace since 2005.
Private sector wages and salaries were up 4.6% year-over-year.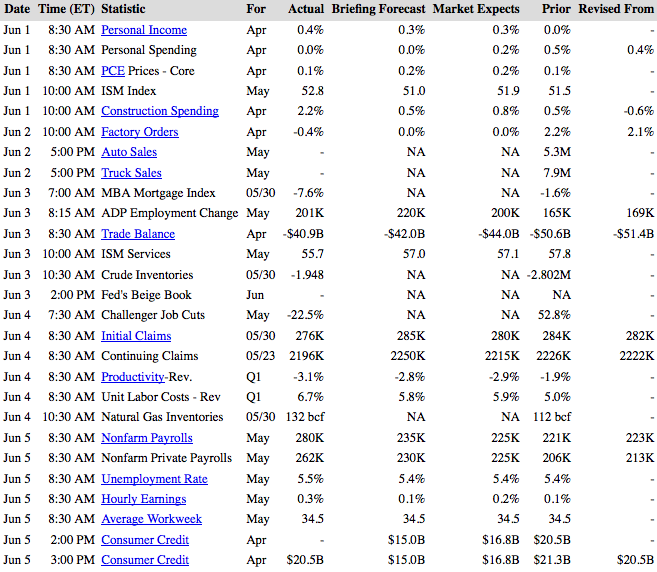
Week Ahead Highlights: It will be a light data week, but the Greek drama may curb investors risk appetites – On Friday, Greece’s Prime Minister called the bailout proposals “absurd,” and Greece decided not to make a payment due to the IMF. Investors’ neutral sentiment has hit a record – Reuters reports that,
“Investors polled by the American Association of Individual Investors have increasingly said they are “neutral” on the market, suggesting uncertainty about where stocks are going.”
“The most recent AAII survey showed 48 percent of investors polled have neutral outlooks for the market for the next six months, while 27 percent are bullish and 25 percent are negative. The bullish figure has been below 30 percent for five weeks, the longest since 2003, while the neutral figure has exceeded 45 percent for nine weeks, longest in the 28-year history of the survey.”
In 2 weeks, a highly anticipated Fed meeting may well determine the fate of the market’s direction for the coming months…stay tuned.
Next Week’s US Economic Reports: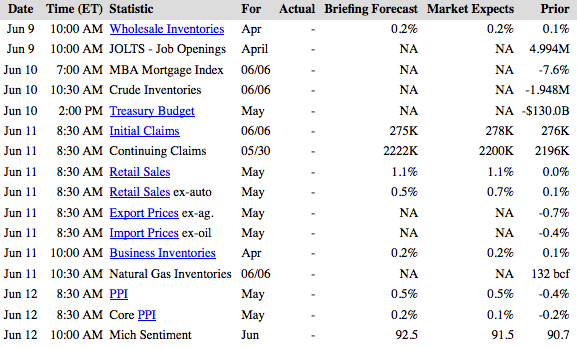
Sectors and Commodities:
Thanks to interest rate hike fears, Financials led this week, and Utilities trailed. Rising rates will add more profitability to Banks’ margins, but it will squeeze firms with heavy debt, such as Utilities.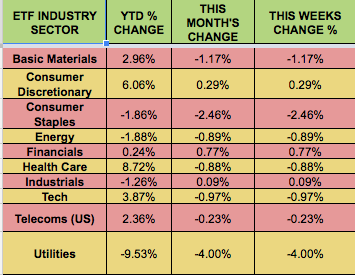
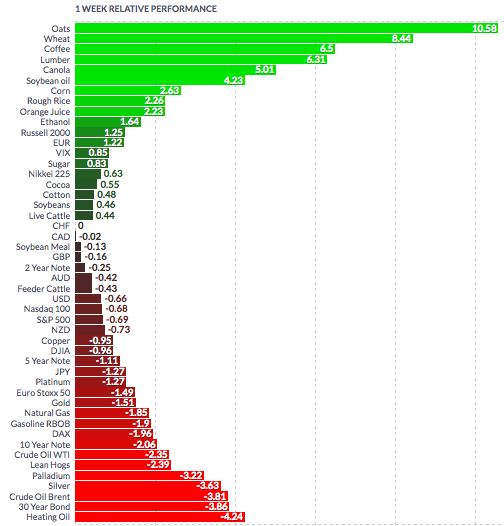
Oats led this week, while heating oil lagged.