Upcoming US Events for Today:- The FOMC Meeting begins
- CPI for May will be released at 8:30am. The market expects a month-over-month increase of 0.2% versus an increase of 0.3% previous. Excluding Food and Energy, the increase is expected to show 0.2%, consistent with the previous report.
- Housing Starts for May will be released at 8:30am. The market expects 1.036M versus 1.072M previous. Building permits are expected to show 1.062M versus 1.080M previous.
Upcoming International Events for Today:
- Great Britain CPI for May will be released at 4:30am EST. The market expects a year-over-year increase of 1.7% versus an increase of 1.8% previous.
- German ZEW Survey for June will be released at 5:00am EST. The market expects Current Conditions to show 62.6 versus 62.1 previous. The survey of Business Expectations is expected to show 35.1 versus 33.1 previous.
- Japan Merchandise Trade for May will be released at 7:50pm EST. The market expects a deficit of ¥1176.4B versus a deficit of ¥808.9B previous.
The Markets
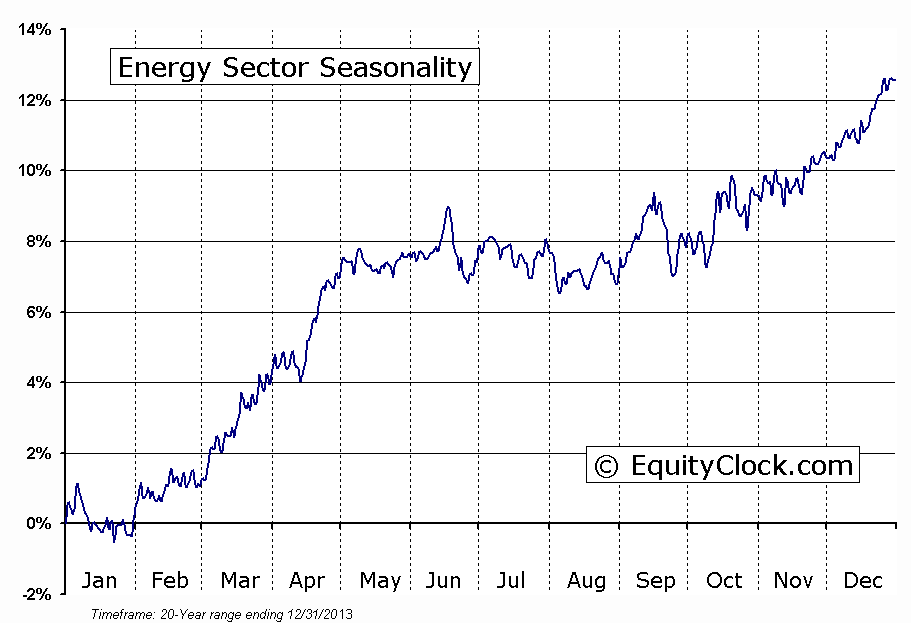
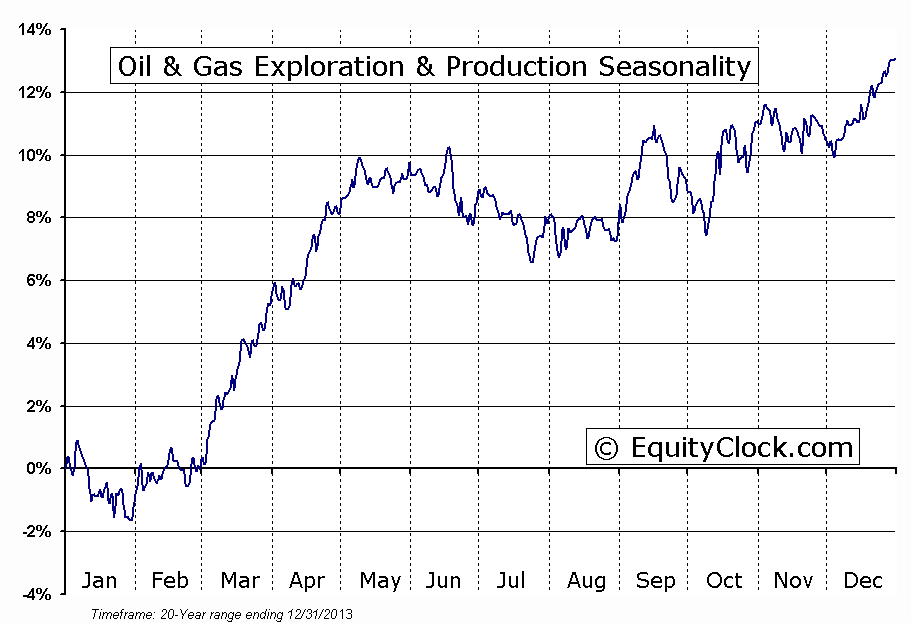
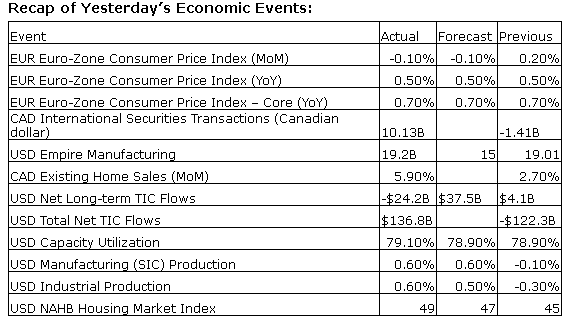
Stocks ended slightly higher on Monday, supported by better than expected economic data pertaining to manufacturing and housing in the US. Risk aversion, however, was apparent during the session with Consumer Staples and Utilities topping the leaderboard as investors remain cautious given the evolving situation in Iraq. Oil prices continue to be elevated, providing ongoing strength to the Energy sector, which is now up 12.4% for the year, according to the Energy Sector ETF (XLE). The broad energy sector seasonally peaks around this time of year, trading flat into the start of summer. The Energy sector ETF is currently the most overbought since November of 2010, according to the Relative Strength Index (RSI). With RSI currently sitting at 81.14, only 5 other days in the history of the ETF have shown readings more overbought than Monday’s close. Upside momentum may be close to exhaustion, increasing the risk of declines, particularly if the event risk in Iraq fades.Seasonal strength for the sector, once again, becomes apparent in the late summer, particularly in the oil exploration and production industry as hurricane season in the US reaches a peak.
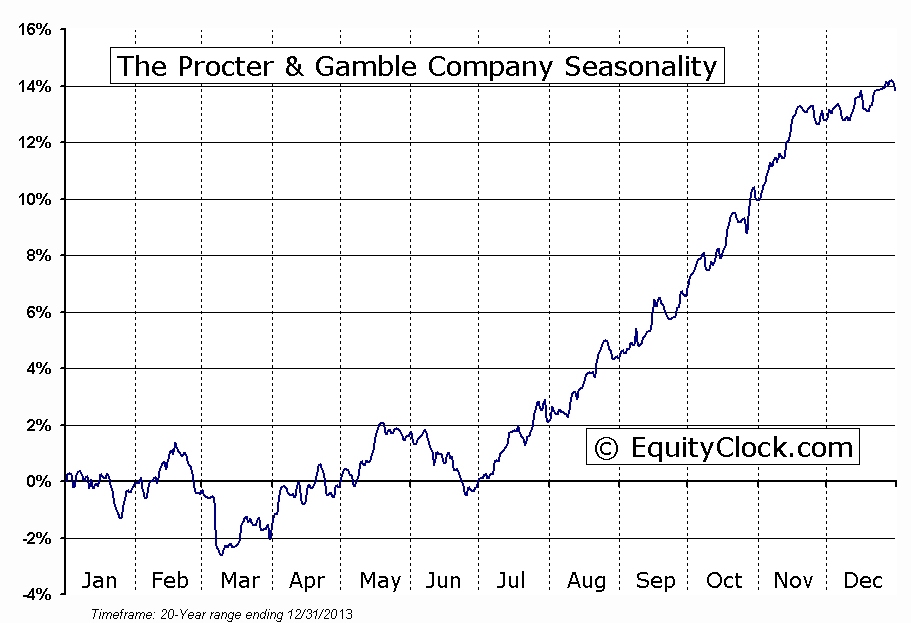
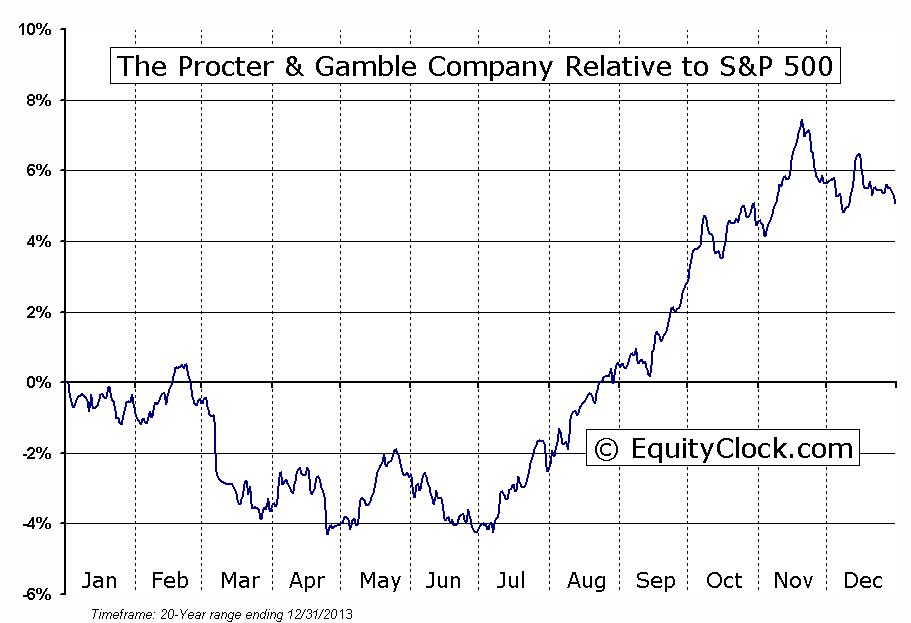
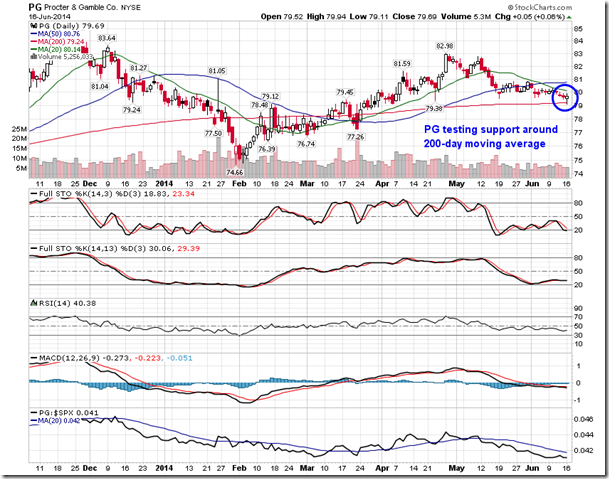
With Consumer Staples showing strength relative to the market during Monday’s session, investors may be looking towards one of the most well known companies within the sector, Procter & Gamble Company (NYSE:PG). The stock enters a period of seasonal strength at this time of year, running through to November. The stock averages a gain of close to 14% over the period, outpacing the S&P 500 by over 11%. The stock tends to perform well amidst the volatility that is common during the summer season as investors seek equity alternatives to reduce portfolio risk. The stock is currently hovering around oversold levels, bouncing from its 200-day moving average during Monday’s session; support at this long-term average can be implied. Watch for seasonal strength into the weeks ahead.
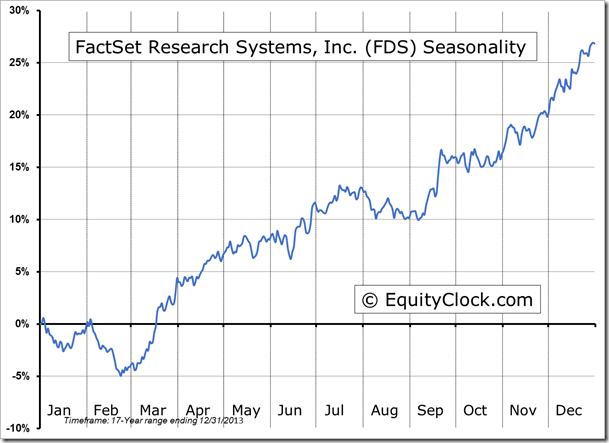
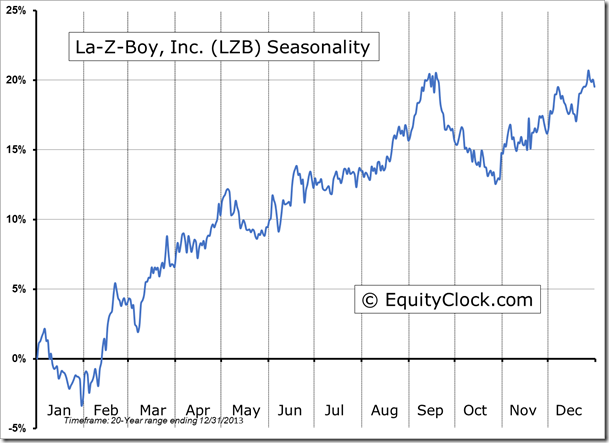
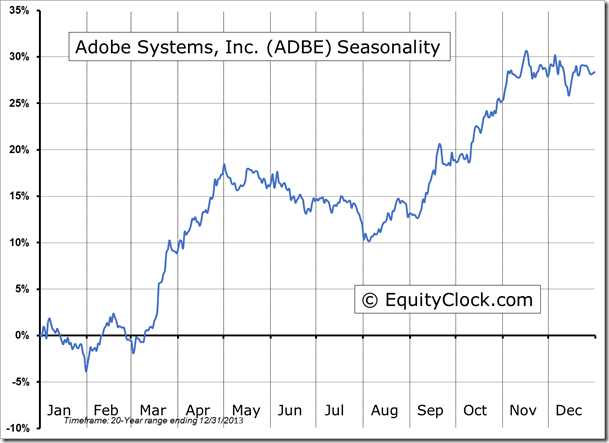
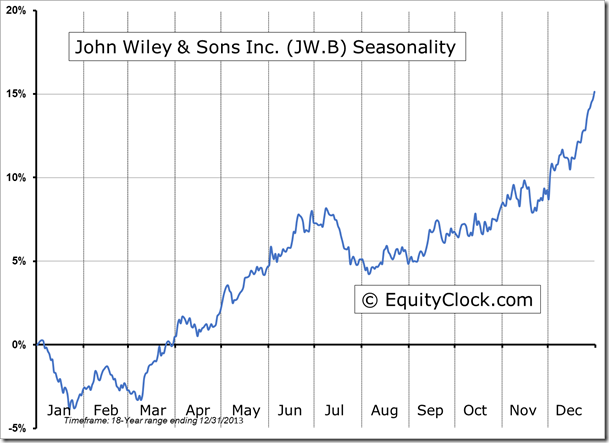
Seasonal charts of companies reporting earnings today:
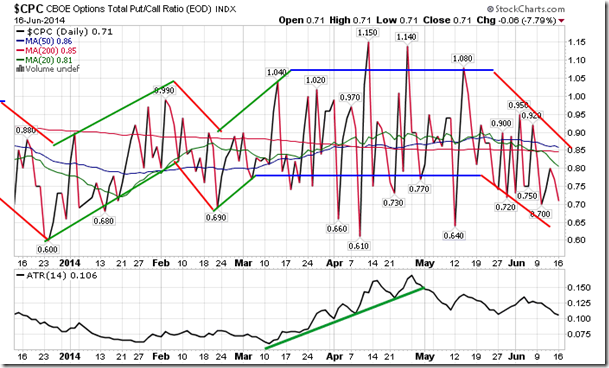
Sentiment on Monday, as gauged by the put-call ratio, ended bullish at 0.71.
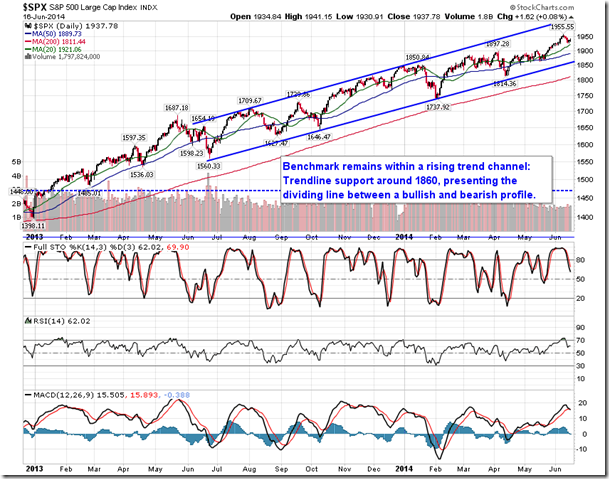
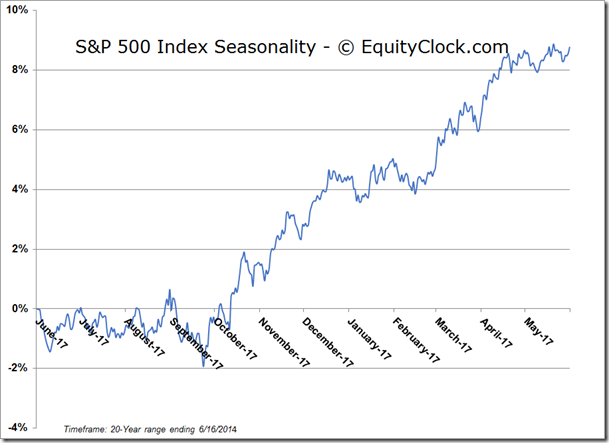
S&P 500 Index
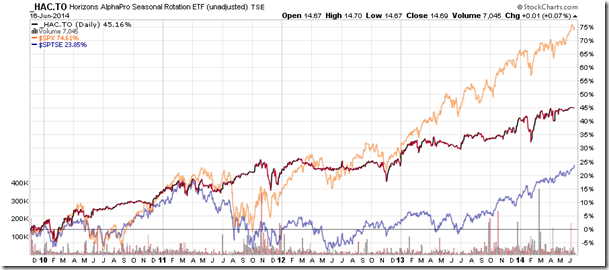
Horizons Seasonal Rotation ETF (TSX:HAC)
- Closing Market Value: $14.69 (up 0.07%)
- Closing NAV/Unit: $14.69 (up 0.03%)
Performance*
| 2014 Year-to-Date | Since Inception (Nov 19, 2009) | |
| HAC.TO | 2.73% | 46.9% |
* performance calculated on Closing NAV/Unit as provided by custodian