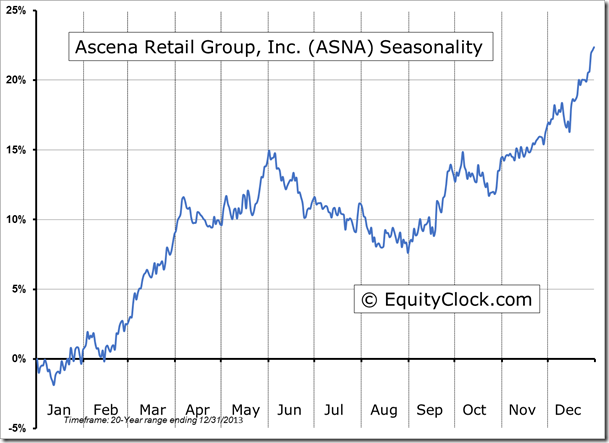
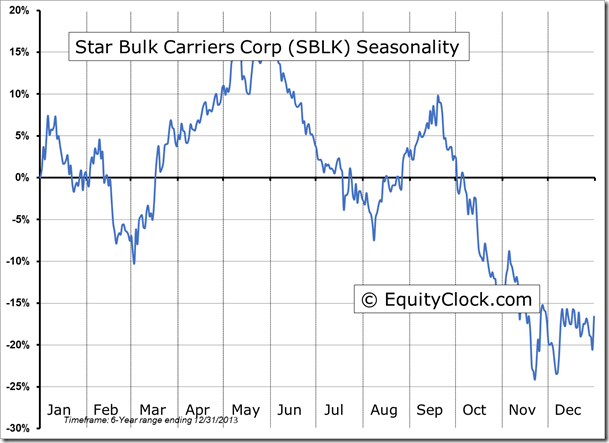
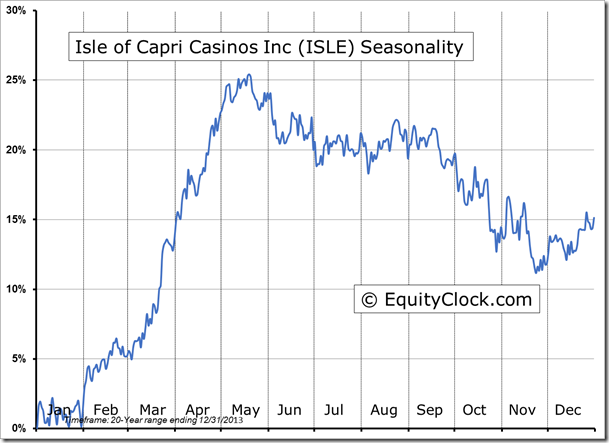
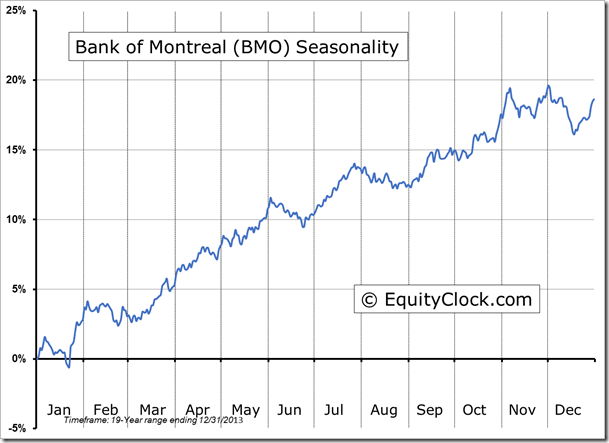
**NEW** As part of the ongoing process to offer new and up-to-date information regarding seasonal and technical investing, we are adding a section to the daily reports that details the stocks that are entering their period of seasonal strength, based on average historical start dates. Stocks highlighted are for information purposes only and should not be considered as advice to purchase or to sell mentioned securities. As always, the use of technical and fundamental analysis is encouraged in order to fine tune entry and exit points to average seasonal trends.
Stocks Entering Period of Seasonal Strength Today:
No stocks identified for today.
The Markets
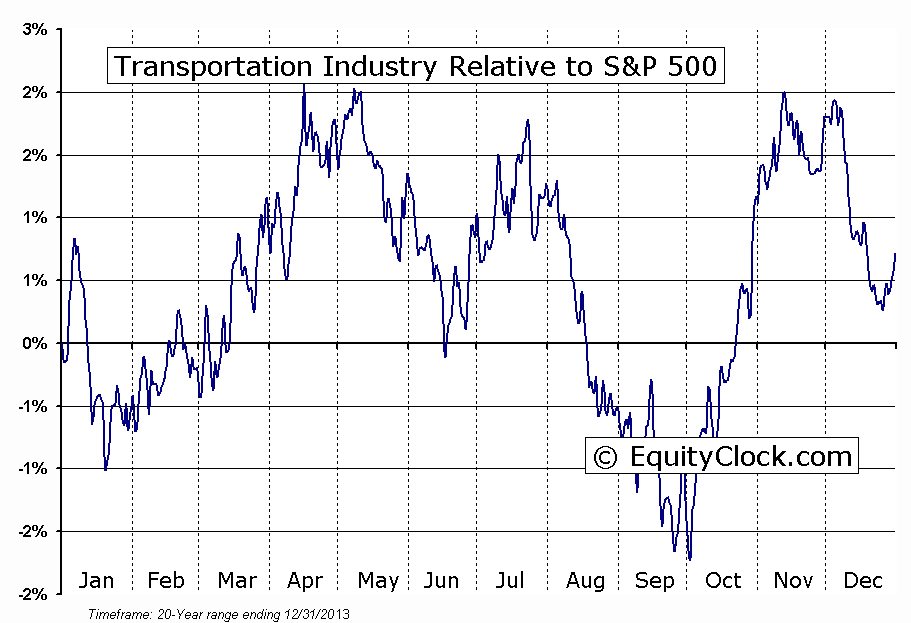
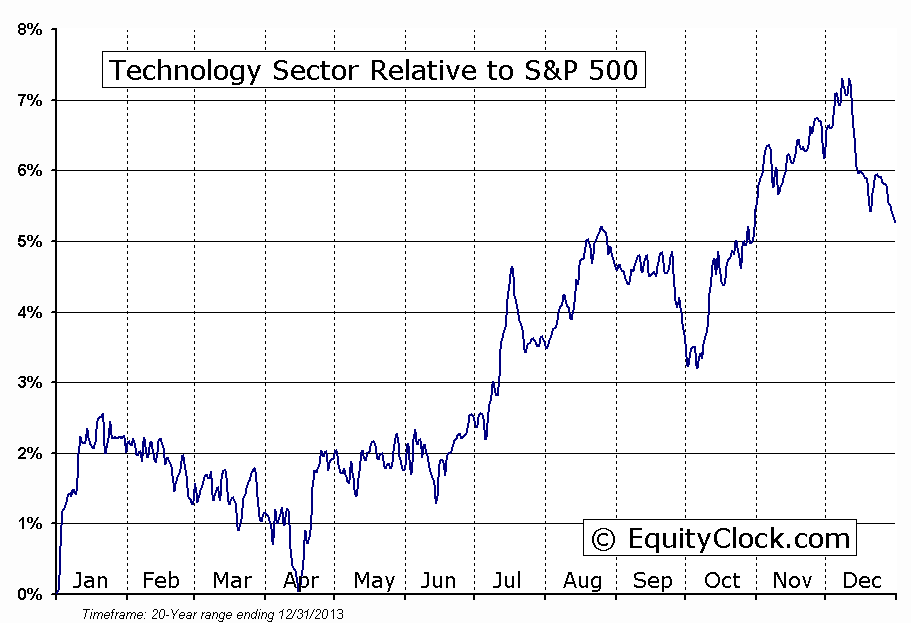
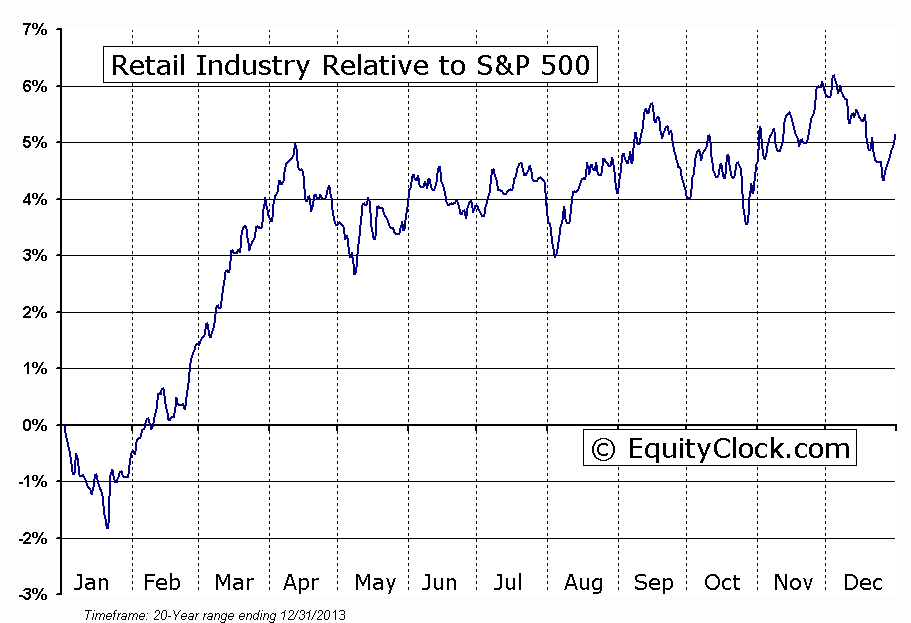
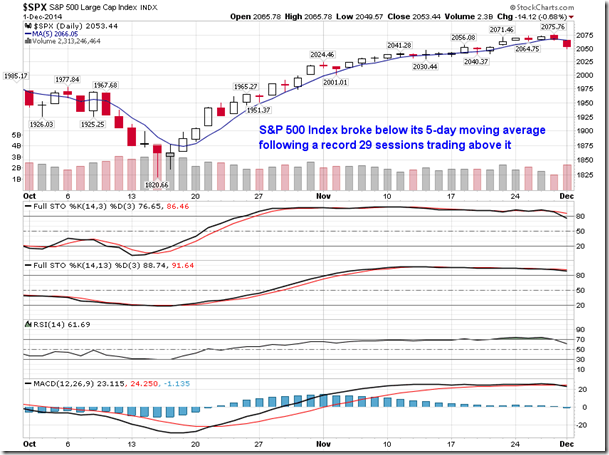
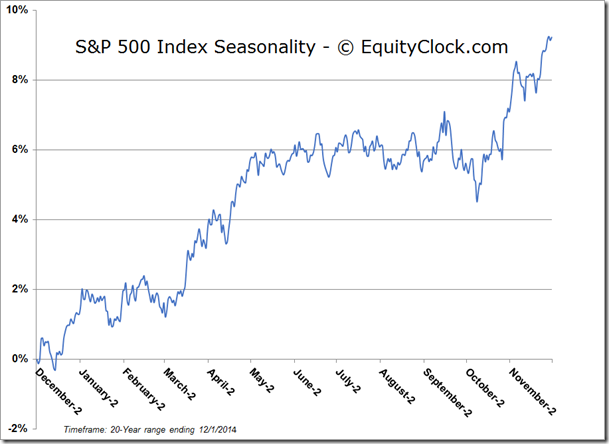
Stocks traded lower on Monday as disappointing manufacturing data overseas and less than expected US Thanksgiving holiday sales weighed on broad market benchmarks. Transportation, Retail, and Technology stocks led the market weakness, selling off following the US holiday that typically marks a seasonal peak in these market segments. As identified last week, underperformance versus the market in each of these areas is typical through the remainder of December. The declines on the day pushed the S&P 500 Index firmly below its 5-day moving average, capping off a record setting run of 29 sessions that the benchmark traded above this short-term average. Equity market strength since the October low has certainly been unprecedented, recovering from significant losses related to a number of headline events at the start of October and trading swiftly to new highs, while becoming substantially overbought in the process.
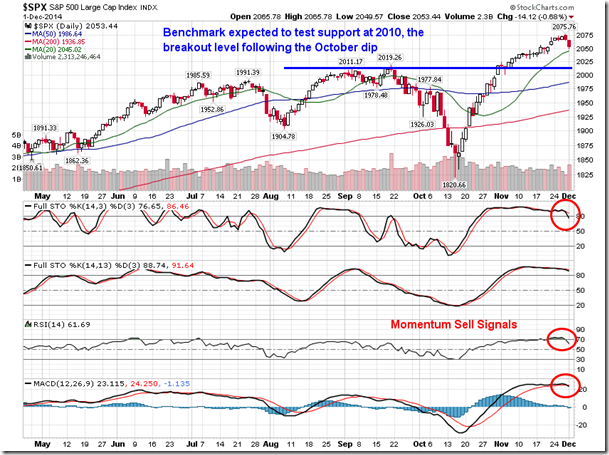
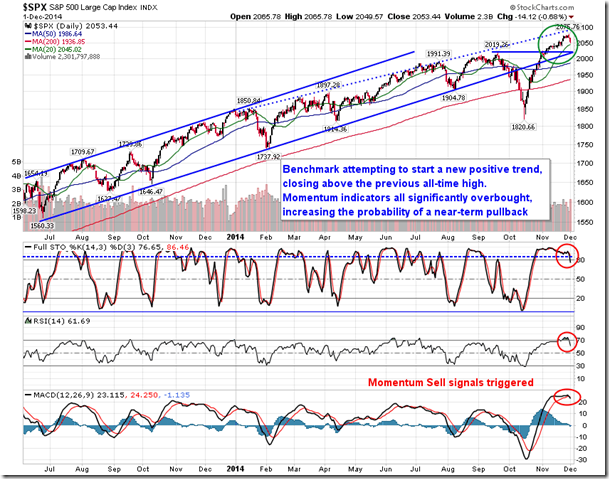
It was inevitable that a retracement would play out in order to test levels of support below. The S&P 500 Index closed just above short-term support presented by its 20-day moving average, however, the more apparent level to watch is 2010, the breakout level that opened the door to the recent run of record highs. Momentum sell signals have been recorded with respect to RSI, Stochastics, and MACD, suggesting a pullback is underway. Of course, weakness is presenting itself during this period that is commonly attributed to tax loss selling as investors reshuffle portfolios ahead of the end of the year. Only 14 days of “regular” trading remain this year before the low volume period surrounding Christmas Day and New Year’s Day begins.Positions with returns of 5% or less are particularly vulnerable to pulling back over this period, including small-cap stocks and the energy sector. However, weakness over the weeks ahead typically leads to appealing buying opportunities for one of the most significant seasonal events on the investment calendar: the Santa Claus Rally period. Stocks rebound from the early month selling pressures as traders enter to accumulate beaten down positions. As well, investment managers will often chase performance into year-end, trying to get a leg-up on the benchmark that has recorded another year of strong returns.
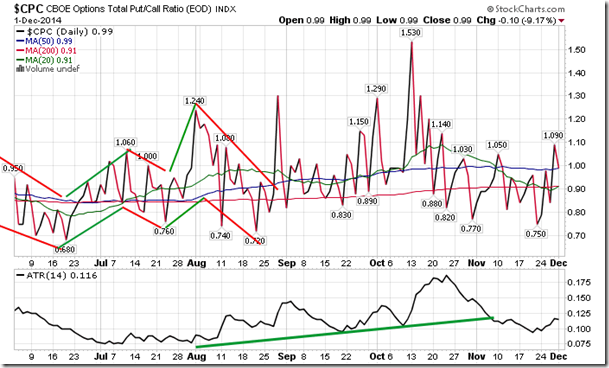
Sentiment on Monday, as gauged by the put-call ratio, ended neutral at 0.99.
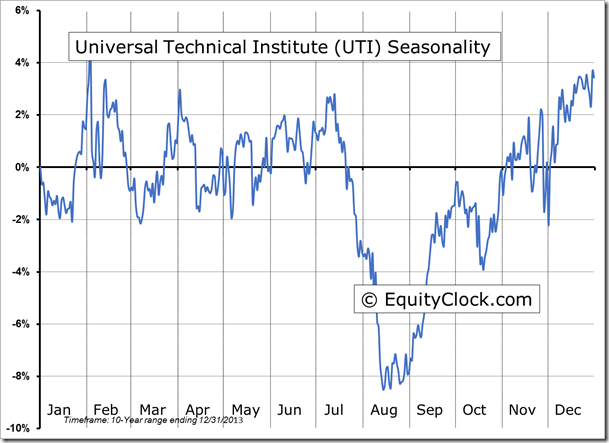
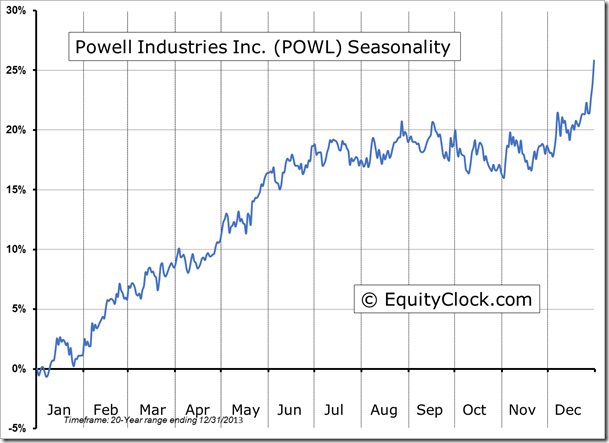
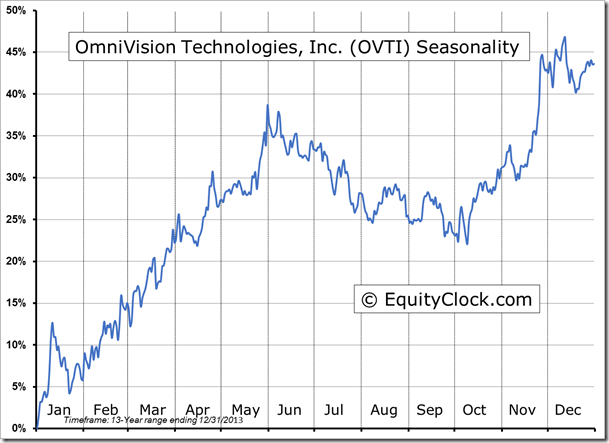
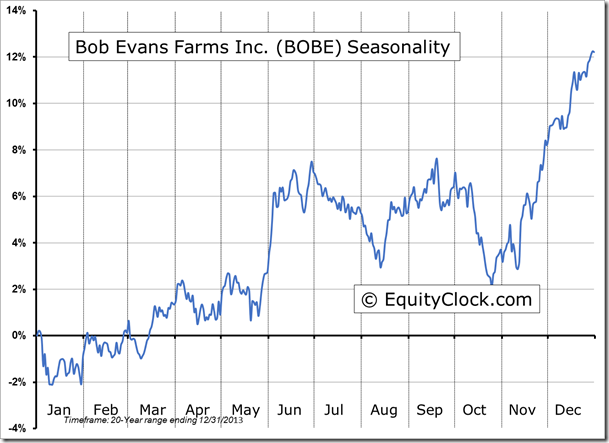
Seasonal charts of companies reporting earnings today:
S&P 500 Index
TSE Composite
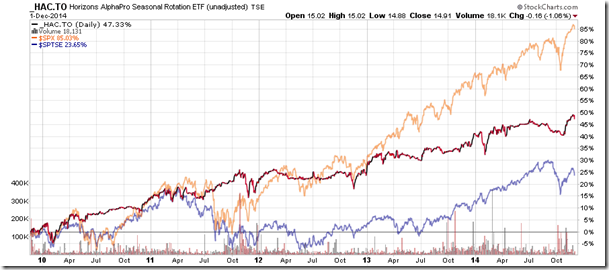
Horizons Seasonal Rotation ETF (TO:HAC))
- Closing Market Value: $14.91 (down 1.06%)
- Closing NAV/Unit: $14.93 (down 1.11%)
Performance*
| 2014 Year-to-Date | Since Inception (Nov 19, 2009) | |
| HAC.TO | 4.41% | 49.3% |
* performance calculated on Closing NAV/Unit as provided by custodian
