
**NEW** As part of the ongoing process to offer new and up-to-date information regarding seasonal and technical investing, we are adding a section to the daily reports that details the stocks that are entering their period of seasonal strength, based on average historical start dates. Stocks highlighted are for information purposes only and should not be considered as advice to purchase or to sell mentioned securities. As always, the use of technical and fundamental analysis is encouraged in order to fine tune entry and exit points to average seasonal trends.
Stocks Entering Period of Seasonal Strength Today:
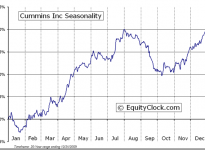
Cummins Inc. (NYSE:CMI) Seasonal Chart
The Markets
Stocks ended flat on Friday despite a solid US employment report for the month of October. The Bureau of Labor Statistics showed that Non-Farm Payrolls increase by 214,000 last month, missing analyst estimates calling for an increase of 240,000. Much of the change in employment can be tied to the pickup in hiring ahead of the holiday season as retailers and restaurants prepare for the uptick in activity through the end of the year. Following the weaker than expected result, the US Dollar Index shed nearly two-thirds of one percent and bond prices showed firm gains. While momentum indicators for many US equity benchmarks start to show signs of rolling over, momentum indicators for treasury bond funds are starting to curl higher, beginning to suggest the start of the next move higher. Treasury bond funds, such as the iShares 7-10 Year Treasury Bond Fund (ARCA:IEF) have been charting a trend of higher-highs and higher-lows all year, despite calls for higher rates (lower prices) over the same timeframe; a topping pattern has yet to be realized, which would signal a peak to the bull market trend in bond prices. The price action in the bond market has once again caused yields to diverge from the direction of equity prices; typically yields and equity benchmarks will generally trend in the same direction as investors maintain either risk-on or risk-off allocations. With the two markets, bond and equity, betting in different directions, one side is clearly off-side. The divergence in yields and equity prices was also apparent between mid-2012 and mid-2013, eventually resulting in a a rather steep decline in bond prices coming into the summer of 2013. This caught many investors off guard due to the general perception that the bond market is “always right” given its sheer size relative to equity equity markets. Eventually, one market will correct, ending the divergence and leaving investors to quickly adjust allocations; as for which market corrects has yet to be seen given the ongoing positive trends in US equity and bond prices.


The divergence between yields and equity prices comes amidst an ongoing intermediate negative trend amongst worldwide equity indices. The MSCI World ETF (NYSE:URTH) has charted a series of lower-highs and lower-lows since peaking this summer; the 50-day moving average of the worldwide benchmark ETF is pointing lower, moving in on the 200-day moving average in what may become a bearish crossover. Momentum indicators are starting to show signs of rolling over following the rebound rally from the October low, hinting of yet another lower intermediate high, potentially continuing the negative trend to new 52-week lows. Weakness in European Indices, as well as commodity sensitive markets in Canada and Australia, are culprit for the weakness in global benchmark. Strength in US equities will continue to be strained as long as global equities trend downward. Newly emerging positive trends in the Tokyo Nikkei Average and Shanghai Composite may help to offset some of the strain. A careful eye on the trends of some of these global benchmarks, such as the MSCI World Source (LONDON:MXWO), All Country World, or FTSE All World Index, appears warranted as they are presently suggesting that equities aren’t as healthy as what the S&P 500 Index is indicating. Worldwide equity benchmarks are presently within a period of seasonal strength that runs through to May and June.

Looking ahead, this week begins a parade of earnings from retailers, providing the last gauge of strength of the consumer ahead of the always important holiday spending season. Earnings are expected from Fossil Group Inc (NASDAQ:FOSL), Macy's Inc (NYSE:M), Wal-Mart Stores Inc (NYSE:WMT), Kohl's Corporation (NYSE:KSS), Nordstrom Inc (NYSE:JWN), and JC Penney Company Inc Holding (NYSE:JCP). Thus far, the Consumer Discretionary sector has performed poorly since the equity market rebounded from the mid-October low; underperformance versus the S&P 500 Index has been apparent, providing some concern pertaining to the strength of the consumer into the important buying season. The retail industry, according to the S&P Retail Index ETF (NYSE:XRT) has performed slightly better than the broad discretionary sector, recording returns on par with broad market indices over the past three weeks. Retail stocks benefit from a minor period of strength between the end of October and the beginning of December, peaking around the notorious black Friday shopping day. The dominant seasonal trend for the industry is realized more towards the spring as earnings results from the Christmas quarter are released and consumers purchase big ticket items, such as automobiles and household goods, following the conclusion of the cold winter weather. Consumer Discretionary is the fourth largest sector of the S&P 500 Index, representing a weight of 11.53%, therefore the performance of this sector has a fairly important role on the performance of the broad market.


 Seasonal Chart")
 Seasonal Chart")
 Seasonal Chart")
 Seasonal Chart")
 Seasonal Chart")
 Seasonal Chart")
Sentiment on Friday, as gauged by the put-call ratio, ended bullish at 0.95.

Seasonal charts of companies reporting earnings today:


S&P 500 Index


TSE Composite


Horizons Seasonal Rotation ETF (TO:HAC)
- Closing Market Value: $14.79 (down 0.34%)
- Closing NAV/Unit: $14.81 (down 0.21%)
Performance*
| 2014 Year-to-Date | Since Inception (Nov 19, 2009) | |
| HAC.TO | 3.57% | 48.1% |
* performance calculated on Closing NAV/Unit as provided by custodian
