Upcoming US Events for Today:- Chicago PMI for March will be released at 9:45am. The market expects 58.5 versus 59.8 previous.
- Dallas Fed Manufacturing Index for March will be released at 10:30am. The market expects 3.0 versus 0.3 previous.
Upcoming International Events for Today:
- Japan Housing Starts for February will be released at 1:00am EST. The market expects 968K versus 987K previous.
- Euro-Zone Consumer Price Index for March will be released at 5:00am EST. The market expects a year-over-year increase of 0.8% versus 1.0% previous.
- Canadian GDP for January will be released at 8:30am EST.
- Japan Tankan Large Manufacturers Index for the First Quarter will be released at 7:50pm EST. The market expects 19 versus 16 previous. Large Manufacturers Outlook is expected to show 13 versus 14 previous. Non-Manufacturing Index is expected to show 25 versus 20 previous. Non-Manufacturing Outlook is expected to show 16 versus 17 previous.
- China Manufacturing PMI for March will be released at 9:00pm EST. The market expects 50.1 versus 50.2 previous.
- China HSBC/Markit Manufacturing PMI for March will be released at 9:45pm EST. The market expects 48.1, consistent with the previous report.
The Markets
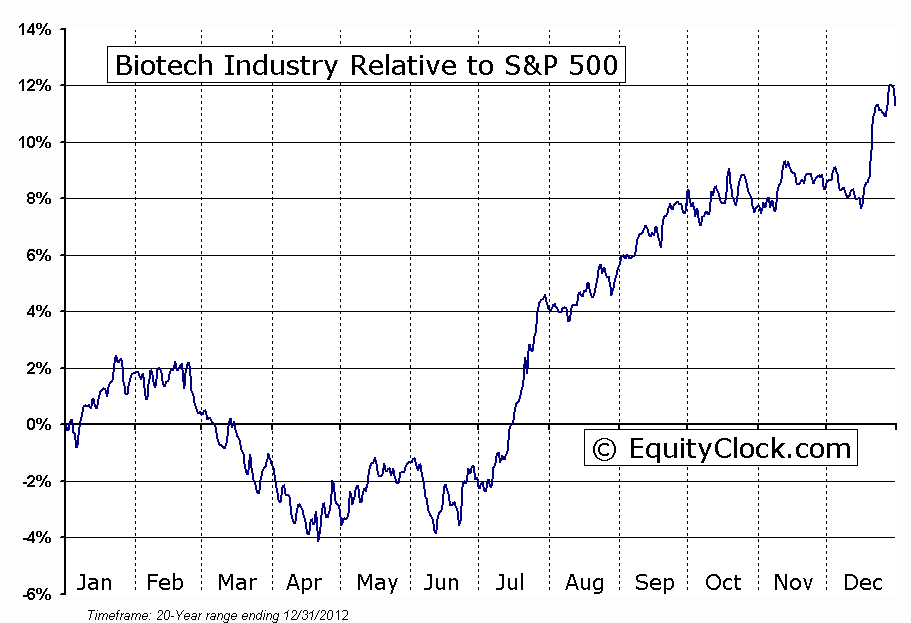
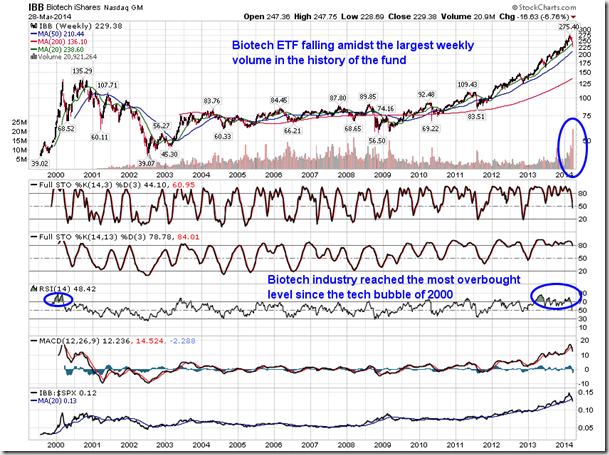
Stocks ended with gains on Friday, but well off of their highs as momentum stocks continued to drag. The Biotech ETF (IBB) fell 6.76% last week with the highest volume recorded in the history of the fund. The industry ETF continues to roll over from the most overbought levels since the tech bubble of 2000 as investors swiftly book profits. The Biotech Industry is still up around 150% following the parabolic move charted over the past 2 and a half years. Biotechnology stocks remain in a period of seasonal weakness through to mid-April; the next period of seasonal strength runs from mid-June through to mid-September. The volatility in momentum stocks continues suggest that investors are losing confidence in equity markets as benchmarks in the US struggle near the highs of the year.
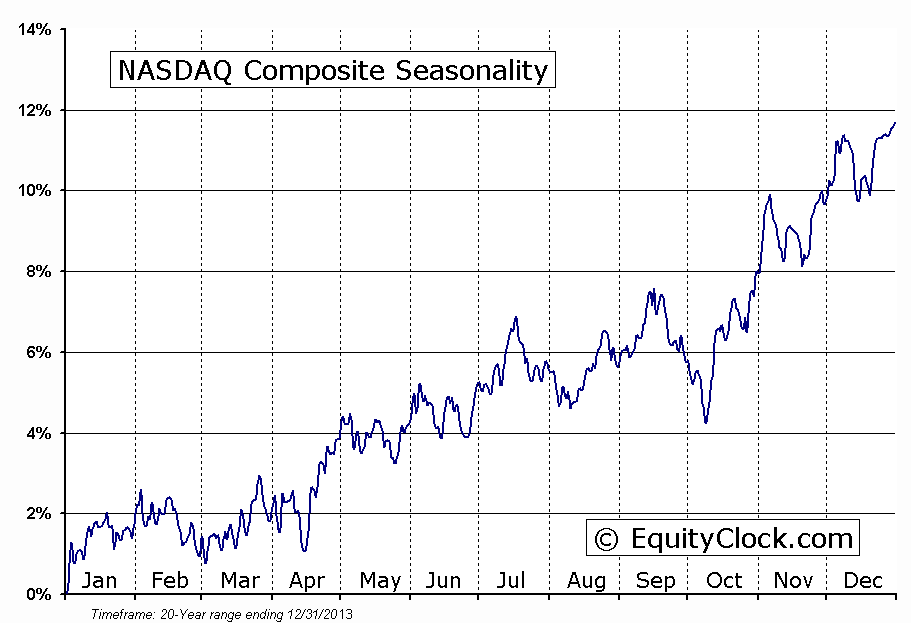
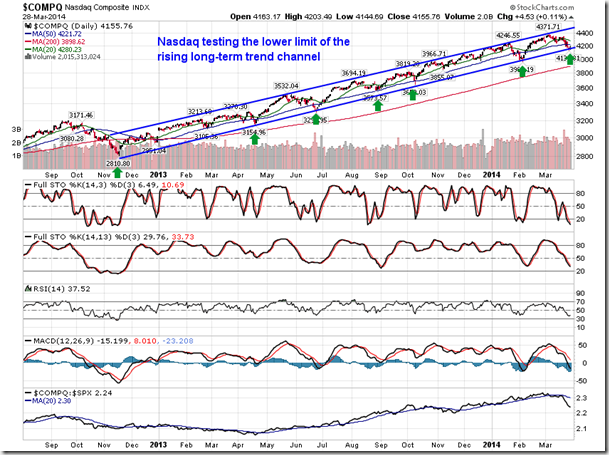
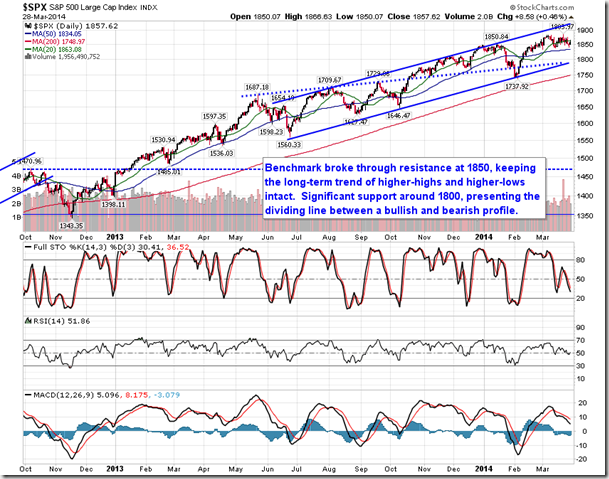
The weight of the biotechnology sector has put tremendous weight on the technology heavy Nasdaq Composite, which is down 3.5% for the month of March; the S&P 500 and Dow Jones Industrial Average are hovering around the flatline for the month. The Nasdaq is now testing the lower limit of a rising trend channel that stretches back to November of 2012. A break below support, presently around 4150, would imply a change of trend. The next period of seasonal strength for the Nasdaq runs from mid-April through to mid-July.
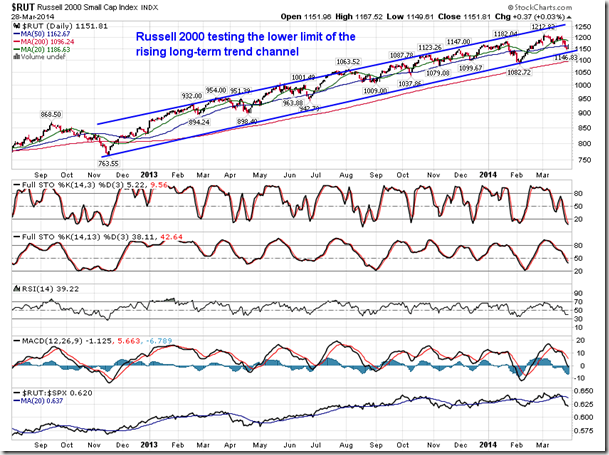
The Russell 2000 Small Cap index is also testing the same trend channel support as the Nasdaq. The Russell 2000 Small Cap index has been under pressure for much of the same reasons, which is that investors are seeking to trim risk as confidence in the long-term trend shows signs of waning. The new quarter starts on Tuesday and it will become apparent fairly quickly if the recent risk aversion is merely a result of quarter-end fund reallocations or the anticipation of things to come. Both the Nasdaq and Russell 2000 are oversold according to stochastics, suggesting downside pressures may temporarily be exhausted, typically a precursor to a short-term rebound.
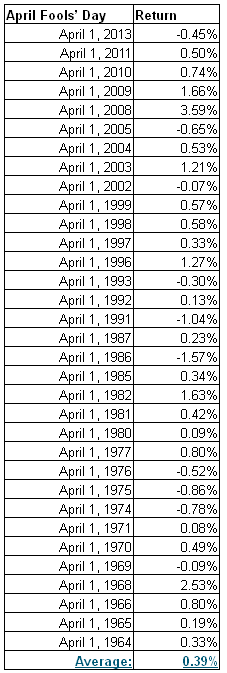
In addition to the start of a new quarter, and new month, Tuesday is also April Fools’ day. Maybe its the upbeat, joking nature of the day, but trading tendencies for the equity market on April 1st are strongly positive. Over the past 50 years, the S&P 500 index has gained an average of 0.39% on this day; positive results were recorded in 70% of sessions. Results over the past 20 years are even stronger with the large cap index posting gains averaging 0.76%, positive in 77% of sessions. Typically, the first day of the new quarter is a positive event for equity markets as new fund inflows help drive equity prices higher. Anticipation of the upcoming earnings season is also a factor that contributes to the positive results into the start of the quarter.
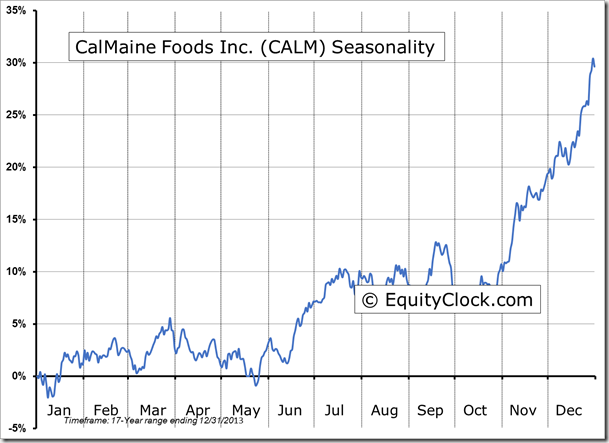
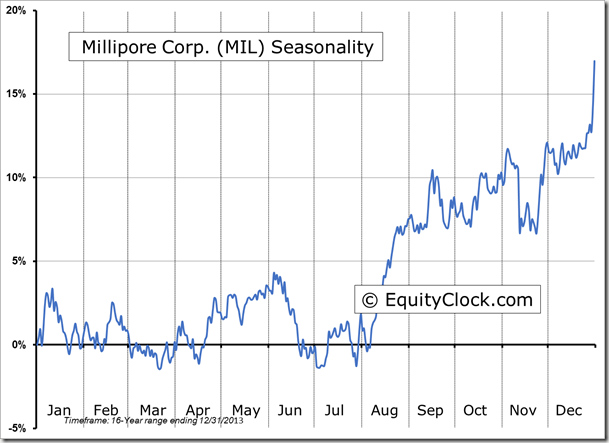
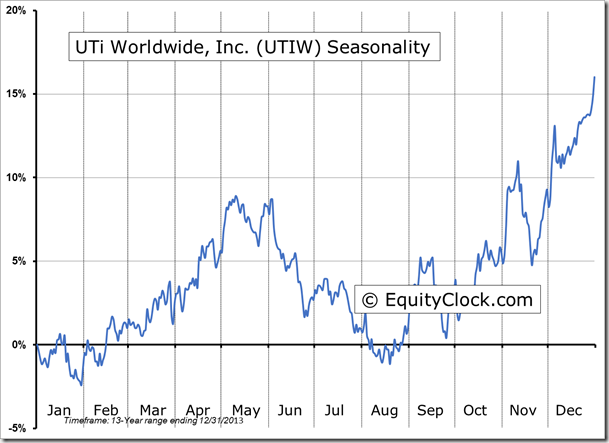
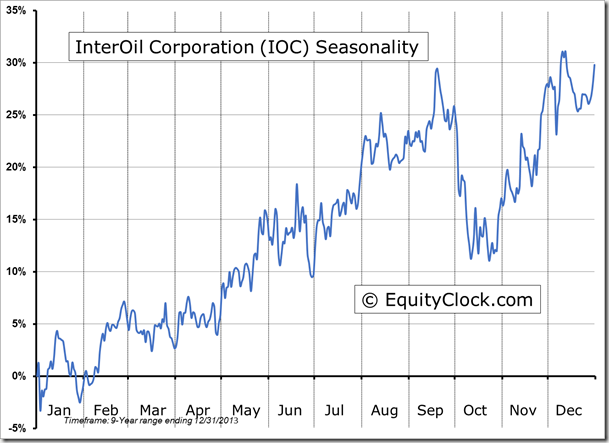
Seasonal charts of companies reporting earnings today:
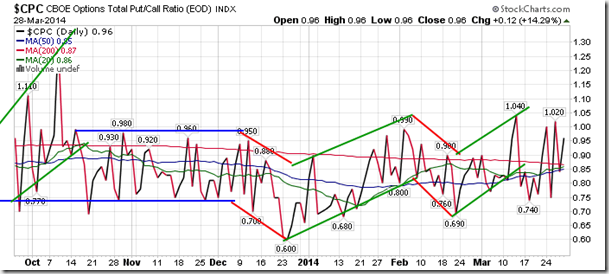
Sentiment on Friday, as gauged by the put-call ratio, ended close to neutral at 0.96.
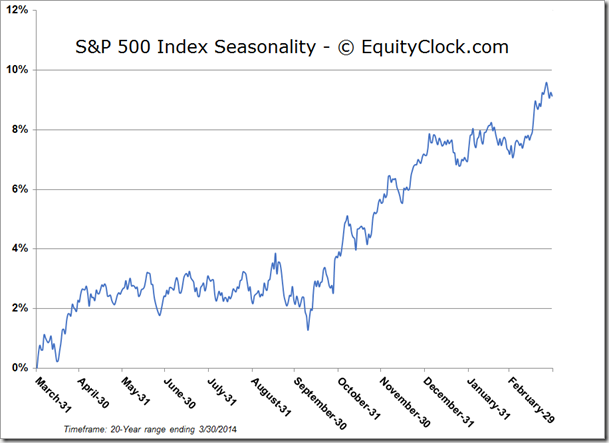
S&P 500 Index
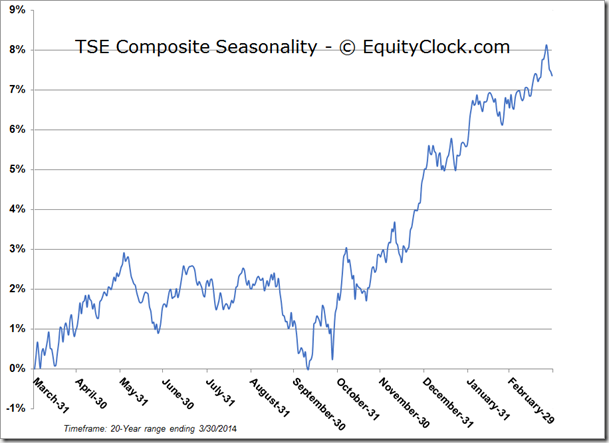
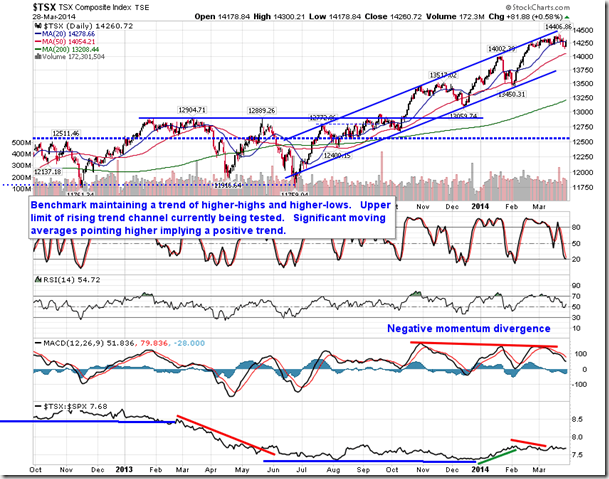
TSE Composite
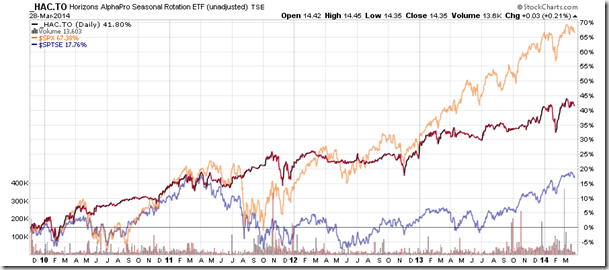
Horizons Seasonal Rotation ETF (HAC.TO)
- Closing Market Value: $14.35 (up 0.21%)
- Closing NAV/Unit: $14.39 (up 0.40%)
Performance*
| 2014 Year-to-Date | Since Inception (Nov 19, 2009) | |
| HAC.TO | 0.63% | 43.9% |
* performance calculated on Closing NAV/Unit as provided by custodian

