
Stocks Entering Period of Seasonal Strength Today:
 (NYSE:DEO) Seasonal Chart")
Diageo plc (ADR), (NYSE:DEO)
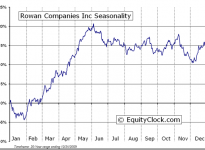
Rowan Companies, (NYSE:RDC)
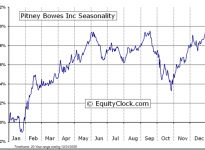
Pitney Bowes (NYSE:PBI)
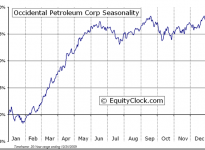
Occidental Petroleum, (NYSE:OXY)
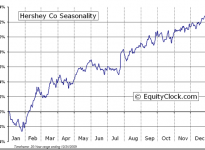
The Hershey Company (NYSE:HSY)
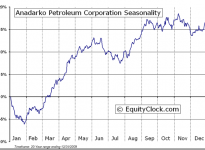
Anadarko Petroleum (NYSE:APC)
The Markets
Stocks gained on Monday, shaking off concerns that the win by the anti-austerity party in the Greek parliamentary elections would re-energize the eurozone crisis. Volume during the session was light as traders left their desks early in order to escape the winter storm that was bearing down on New York City. Despite the threat of a slowdown in economic activity that would result from a winter storm, the equity market typically ends higher during the session following major winter storms in New York City. Following the 6 biggest storms in NYC over the last 60 years, the S&P 500 has gained in 5 of the sessions that followed, averaging a gain of 0.54%. Gains, unfortunately, neutralized in the week following the event with the S&P 500 Index recording an average decline of 0.09%.
Although the results show that there is a negligible impact on the equity market resulting from winter storms , weather during the winter can have a negative impact on equity market performance if it is prolonged and unconducive to production for various industries. Last year was a case in point. Colder than average temperatures throughout the winter season last year negatively influenced consumer stocks, causing underperformance in the discretionary sector through what is typically a period of seasonal strength. As a result, broad equity benchmarks remained choppy through the first four months of 2014.
With the weather trend for New York City forecasted to be colder than average over the next two weeks, a similar impact on the equity market as what was recorded last year cannot be ruled out. Sluggish equity market performance during colder than average winters is typically short-lived as the spring rebound in economic activity tends to lift stocks.
| S&P 500 Index impact following major winter storms in New York City | |||
| Winter Storm Date | 1-Day Following | 7-Days Following | 30-Days Following |
| 12/26/10 | 0.06% | 0.07% | 2.74% |
| 2/11/06 | -0.33% | 1.60% | 1.35% |
| 2/17/03 | 1.95% | -0.28% | 4.69% |
| 1/07/96 | 0.28% | -2.42% | 4.80% |
| 3/12/93 | 0.36% | 0.08% | -1.78% |
| 2/06/78 | 0.93% | 0.40% | -1.85% |
| Average: | 0.54% | -0.09% | 1.66% |

Despite the initial shock that resulted from the parliamentary election in Greece, equity benchmarks in Europe ended firmly higher on Monday. The DAX, FTSE 100, FTSE MIB, CAC, and IBEX have all recorded strong gains over recent weeks, significantly outperforming US indices as investors take advantage of the value that the European stocks present given that they have largely underperformed American benchmarks since 2009.
The bet remains that the ECB’s bond buying program will have the same beneficial impact on European markets as what the US stimulus had on American stocks. The FTSE, FTSE MIB, and CAC have each broken out of a declining trend that persisted since last summer, opening a path towards higher values in the months ahead. European equity indices have just begun the second leg of their period of seasonal strength that runs from the end of January through to the beginning of May.


Sentiment on Monday, as gauged by the put-call ratio, ended bullish at 0.90. Yet again, another significant swing from one session to the next continues to push the average true range of the ratio higher as uncertainty in equity markets persists. Resistance on the S&P 500 Index remains around 2064; expect uncertainty to remain while the large-cap benchmark holds beneath this previous high.

Seasonal charts of companies reporting earnings today:


S&P 500 Index


TSE Composite


Horizons Seasonal Rotation ETF (TO:HAC)
- Closing Market Value: $15.70 (up 0.13%)
- Closing NAV/Unit: $15.71 (up 0.38%)
Performance*
| 2015 Year-to-Date | Since Inception (Nov 19, 2009) | |
| HAC.TO | 3.83% | 57.1% |
* performance calculated on Closing NAV/Unit as provided by custodian

Disclaimer: Stocks highlighted are for information purposes only and should not be considered as advice to purchase or to sell mentioned securities. As always, the use of technical and fundamental analysis is encouraged in order to fine tune entry and exit points to average seasonal trends.