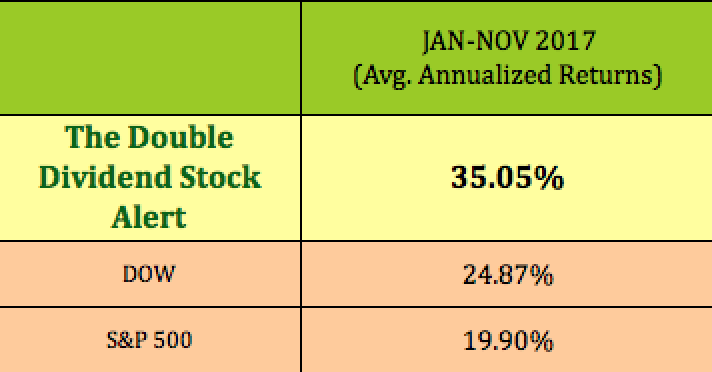
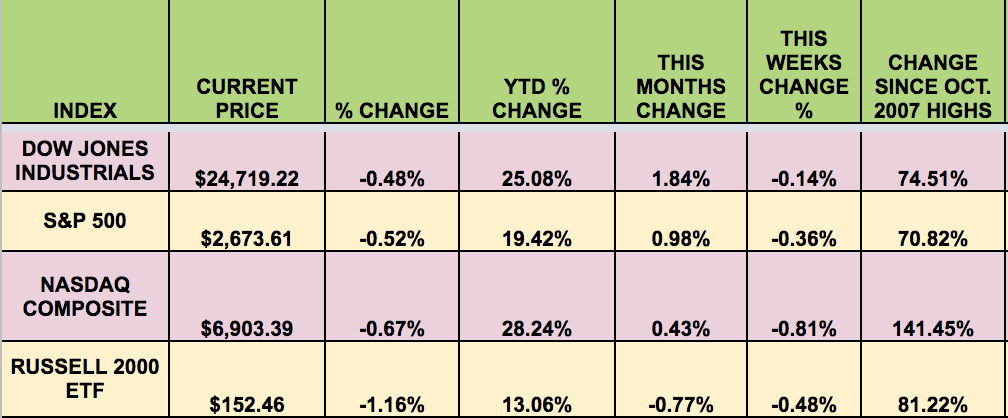
Markets: It was a down week, with typical year end light volume- with all 4 indexes losing ground for the week.The NASDAQ led in 2017, followed by The DOW and the S&P 500, and the Russell Small Caps lagged. The DOW hit new highs 71 times in 2017.
However, looking back for the past 10 years, the DOW is just 75% above its October 2007 highs, which gives it a yearly avg. gain of ~7.5% over the past decade. The S&P 500 has a very similar 10-year avg., at 7.08%, while the NASDAQ clearly outperformed, rising 141% above its October 2007 highs, a 10-year avg. of 14.14%:
Dividend Stocks Update: These high dividend stocks go ex-dividend this coming week: Apple (NASDAQ:AAPL) Hospitality REIT Inc (NYSE:APLE), Brixmor Property (NYSE:BRX), Barnes & Noble Inc (NYSE:BKS), Hersha Hospitality Trust (NYSE:HT), KCAP Financial Inc (NASDAQ:KCAP),
Volatility: The VIX rose 11.52% this week, ending at $11.04.
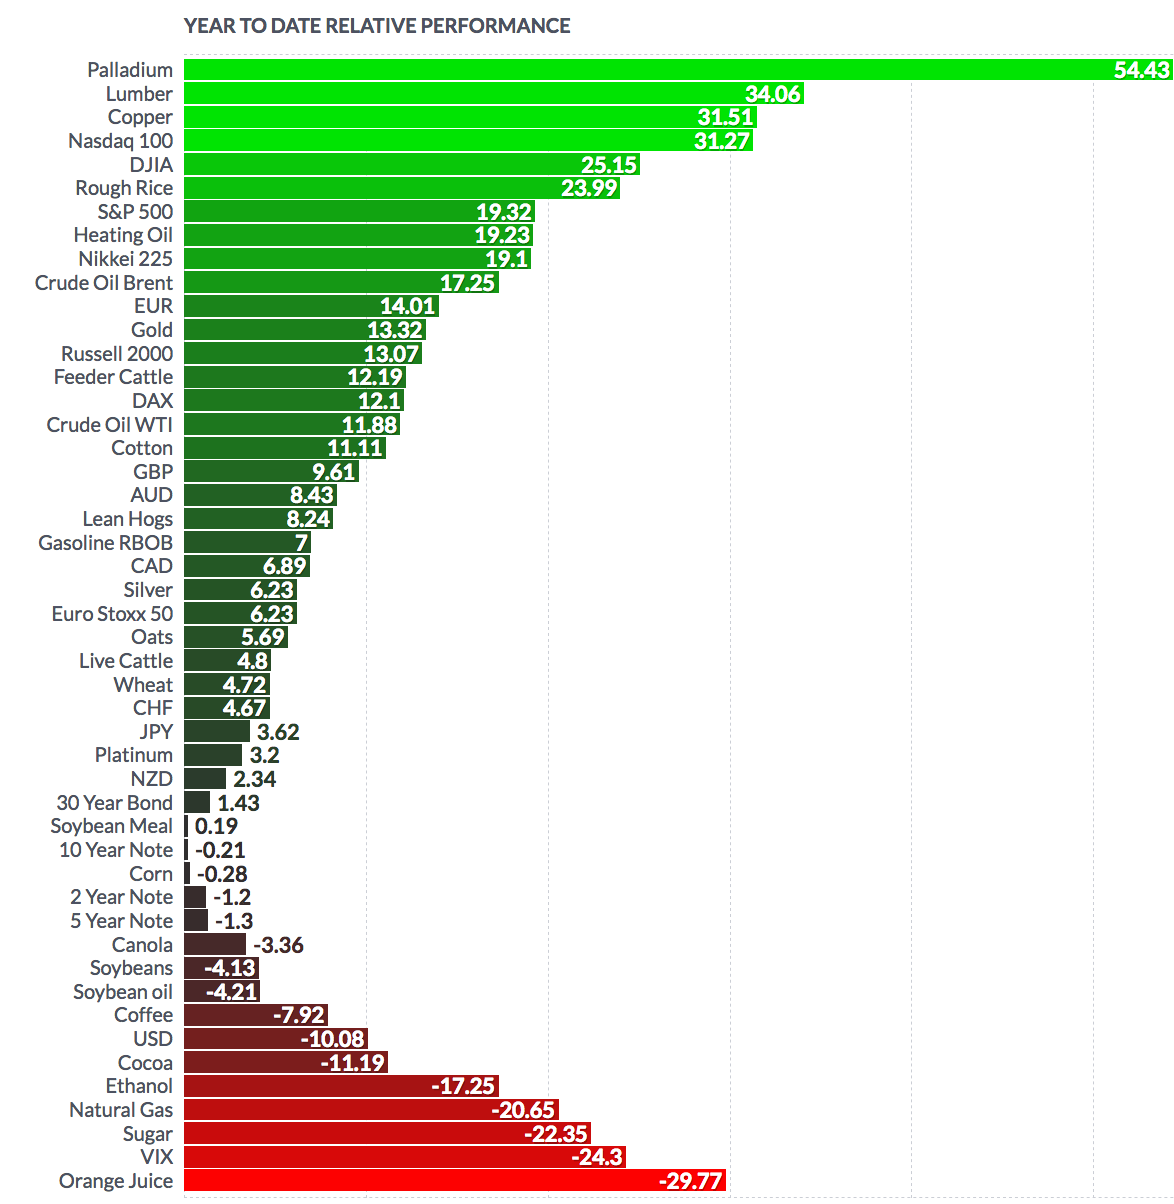
Currency: The $ fell vs. most major currencies in 2017, with the Euro rallying strongly, up 14.14%, and the Pound up 9.52%.

Market Breadth: 14 of the DOW 30 stocks rose this week, vs. 18 last week. 25 out of 30 DOW stocks rose in 2017, with GE being by far the worst laggard – it lost -45%. 47% of the S&P 500 rose, vs. 57% last week. 76% of the S&P 500 rose in 2017.
Economic News: “The Chicago PMI rose to 67.9, finishing 2017 at the highest level in six years. The index measures how well the economy in the Chicago region is performing. Any reading over 50 indicates improving conditions, and numbers above 60 are exceptional.
What happened: The amount of goods and services produced in the Chicago region hit a 34-year peak, reflecting steadily rising demand. New orders touched a three-and-a-half year high, noted MNI Indicators, publisher of the report.
The Chicago PMI is the latest in a series of economic signposts that show the U.S. finishing 2017 and entering 2018 with a good head of steam. Companies expect the economy to expand at a solid 2% to 2.5% annual clip next year, perhaps even better.”
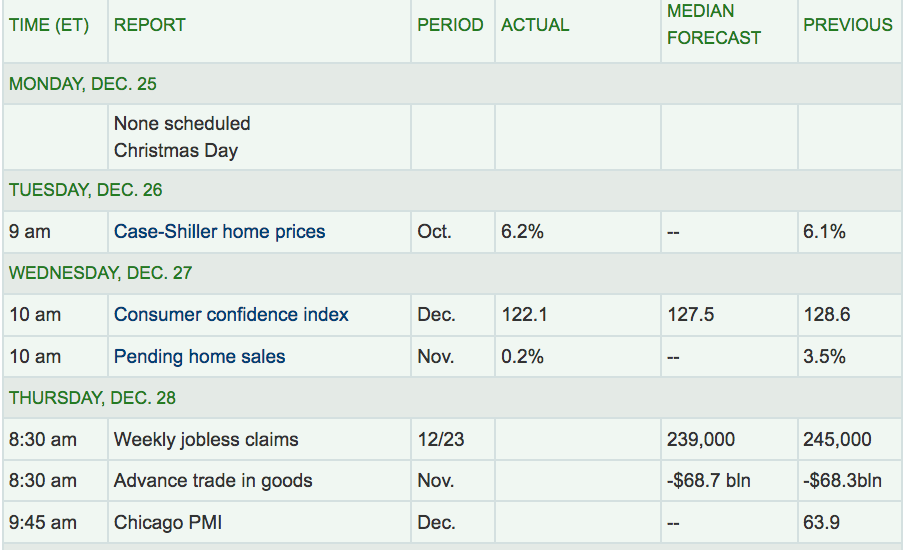
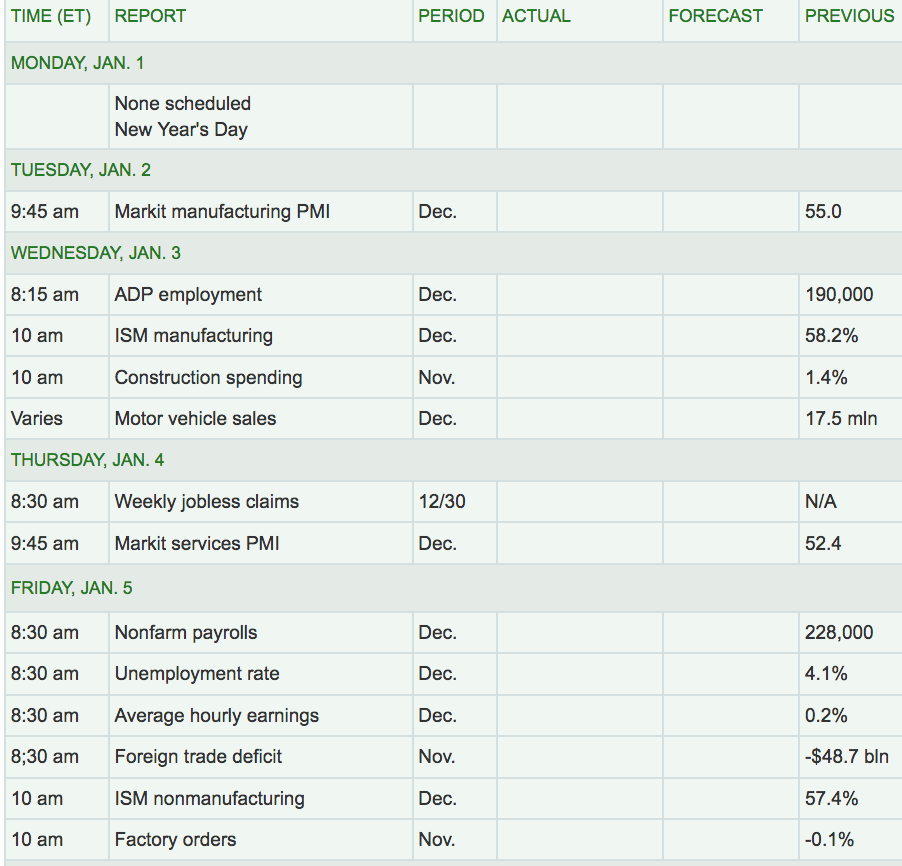
Week Ahead Highlights: It’ll be another short week, with US markets closed on Monday for New Year’s Day.
Next Week’s US Economic Reports: We’ll get a look at NonFarm Payrolls for December and the Unemployment rate, on Friday, which should spur some Fedspeak about 2018 rate hikes. Mfg. data will also be reported, in Tuesday’s Mfg. PMI, and Wed.’s ISM Mfg. report.
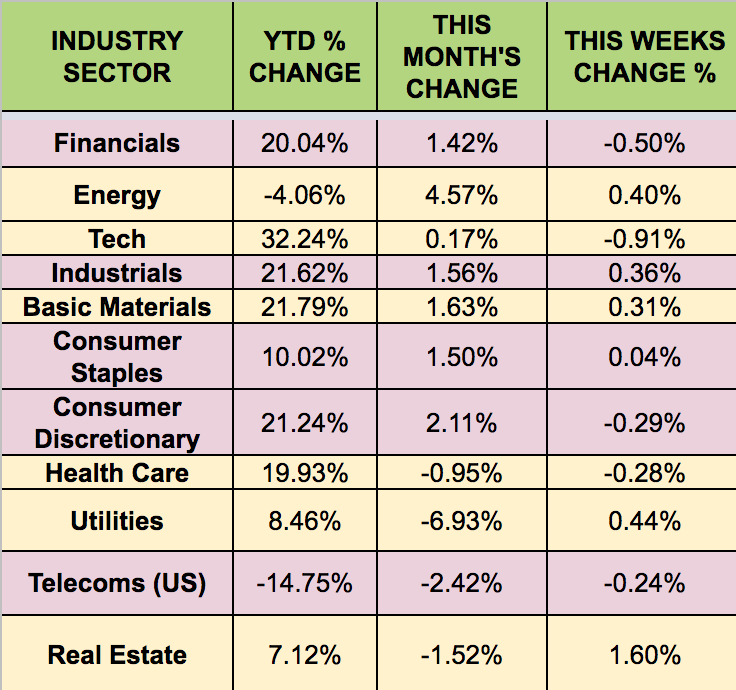
Sectors: The Tech sector outdistanced all others in 2017, in spite of a weak December. Other standouts were basic Materials, Financials, Industrials, and Consumer Discretionary, with broad-based gains in the 4th quarter. Energy and Telecoms lagged, but Energy stocks rebounded in December, to lead all other sectors for the month.
Futures: WTI Crude futures gained 11.88% in 2017, but Natural gas fell -20.65%.
