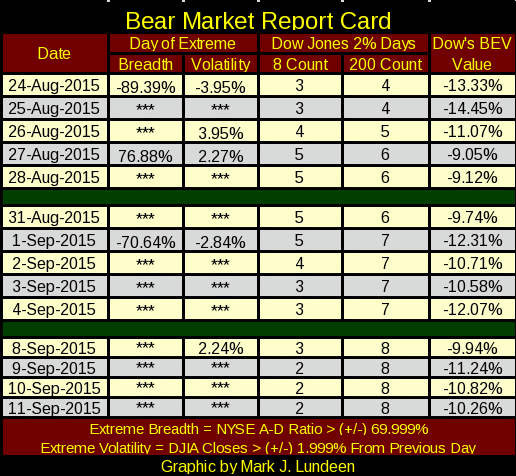
Let’s look at Mr Bear’s report card to see what he’s been up to this week. After one day of extreme volatility on Monday, he’s been behaving himself. Still, the Dow Jones ended the week 10% below its last all-time high of May 2015.

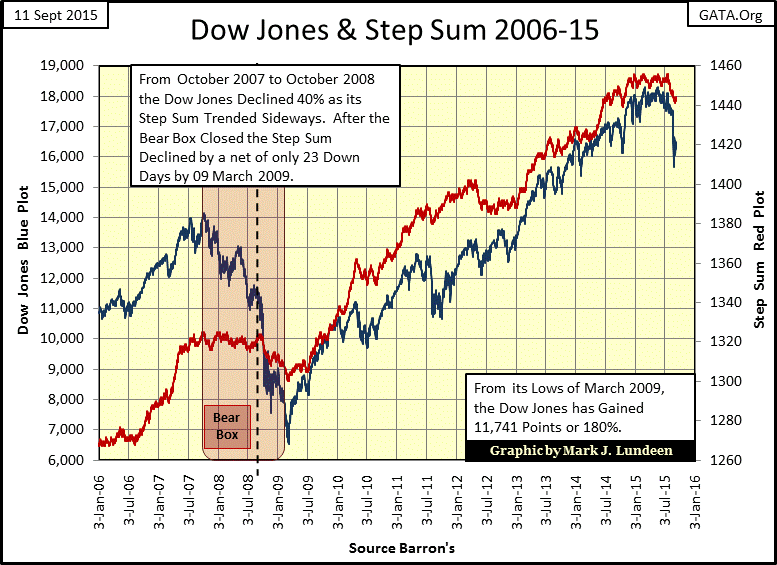
Next graphic is the Dow Jones’ step sum chart, where we see quite a difference in the current decline compared to the beginning of the credit-crisis bear market. From October 2007 through October 2008, the Dow’s step sum’s trend refused to decline with its price until the Dow Jones itself had already dropped 40% from its last all-time high of a year earlier. A bear box such as this is the hallmark of stubborn bullishness in the face of disaster.
Bear boxes form because at first, each market decline seems like a buying opportunity to the bulls. The step sum refuses to go down because the day following any market decline, large or small, the bulls are back scooping up stocks at what seems to be bargain prices.This results in the market going up the next day, canceling out the previous day’s step sum decline. But within a bear box, price gains from advancing days seldom cancel out the losses suffered during the declining days, as the bulls were to discover from October 2007 to October 2008. After a year of declining prices, in October 2008, the Dow Jones finally crashed 40% below its all-time high. Only then did the bear box close as the step sum collapsed (dashed black line), indicating the bulls finally realized that in a bear market, Mr Bear always wins.

In our current market decline, (which I suspect is the beginning of a massive bear market that will take the Dow Jones down 70% or more before it’s over), the bulls have so far been wary of scooping up bargains as the market declined.
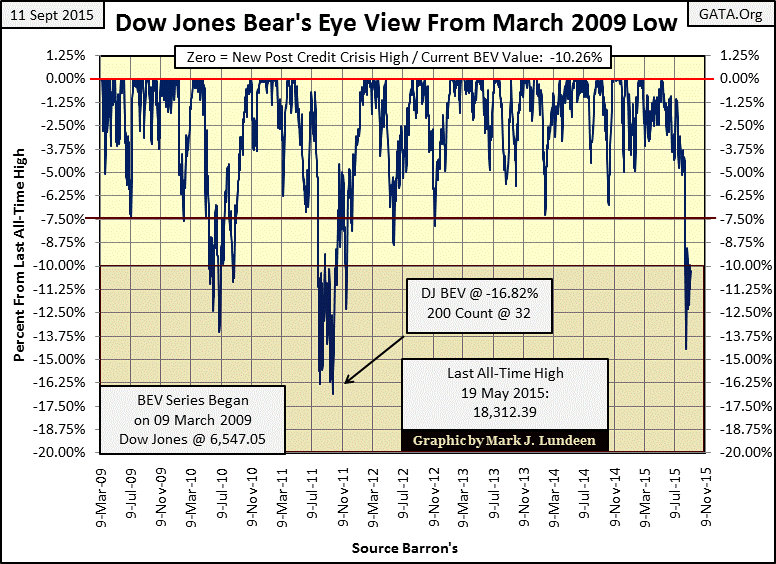
Next we see the Bear’s Eye View (BEV) for the Dow Jones from the absolute bottom of the credit crisis bear market. BEV charts compress market history within a percentage range of only 100 percentage points:
0.00%: (aka BEV Zero) = new high for the move OR new all-time high.
-100%: Total wipeouts of market valuations.
In the chart below, we don’t have a sense of the success the “policy makers” had re-inflating the market from its credit-crisis lows of March 2009. In a BEV plot, every new high of the move or all-time high is registered as a 0.00%. Whether the new BEV Zero is two cents or two hundred dollars above the previous BEV Zero, it’s all the same to Mr Bear – a big fat zero.

The amazing thing the chart above misses is that from the Dow Jones’ March 9, 2009 bottom (6,547) to its last all-time high of May 19th, 2015 (18,312), the Dow Jones advanced 11,765 points. At the very top of Greenspan’s high-tech bubble in January of 2000, the Dow Jones peaked at 11,722 following an eighteen year bull market. So, incredibly, just the six year gain in the Dow Jones since 2009 actually exceeded the entire cumulative value of the Dow at its peak before the crash of the high tech bubble. The Dow Jones’s amazing gains since March 2009 only happened because the know-it-all academics sitting at the FOMC decided to inflate market valuations with massive “injections of liquidity.”
Does that bother you? It should! There’s going to be deflationary hell to pay before this bear market is over. The Dow Jones ended the week only 10.26% below its Terminal Zero (TZ: last all-time high of a bull market). The best way to capitalize on our current high-market prices is to exit the market while you still can, and don’t be in any hurry to get back in.
Are there some market yardsticks we can use to gauge when it’s safe to re-enter the market? I believe there is: when the Dow Jones dividend yield rises significantly above 6%. And as the “policy makers” have manipulated the entire yield curve far below where the free market would have had them – for years, I’ll also be paying attention to the yield on the Treasury’s long bond. When the Treasury’s long bond yield exceeds its October 1981 all-time high of 15%, we can take that as a bullish indication that most of the inflation currently in market valuation has deflated. But these two market conditions won’t happen until the climatic end of our bear market, which may be years from now. Warning: if you tell anyone about my two market yardsticks, they’ll think you’re crazy. But then most people accept current market valuations and the past seven years of zero interest rate policy as normal.
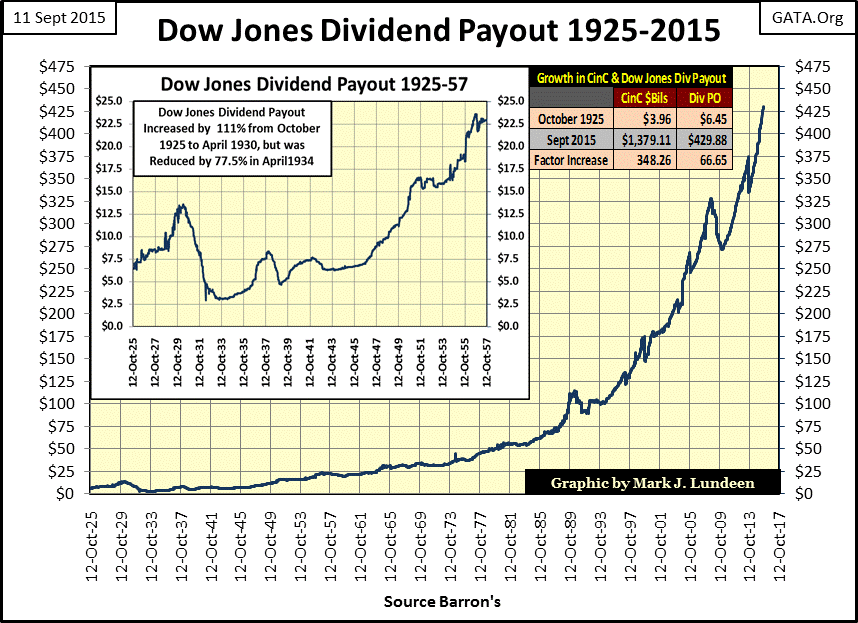
In any bear market, dividends become increasingly important, though not immediately. Barron’s began publishing Dow Jones dividend payouts and yields back in October 1925. The chart below shows the ninety year history of Dow Jones dividend payouts.
It quickly becomes evident why dividend income, unlike bond income, is not classified as “fixed income.” Bonds are contracts for debt. Investors buy a 20 year bond for say $1,000 with a 5% coupon, and for the next twenty years the company pays out $50 a year to the bond holder and then returns the $1,000 after the twenty years. But investing in bonds only makes sense if the currency in which the bond issuer services its debts is based on gold or silver.
Our “modern” monetary system is based on an ever increasing volume of fiat money in circulation, a system designed to benefit the few at the cost of the many.
"The few who can understand the system (An American Central Bank) will either be so interested in its profits, or so dependent on its favors, that there will be no opposition from that class, while on the other hand, the great body of the people, mentally incapable of comprehending the tremendous advantages that capital derives from the system, will bear its burdens without complaint and perhaps without even suspecting that the system is inimical to their interests."
- John Sherman, protégé of the Rothschild banking family, in a letter sent in 1863 to New York Bankers, Morton, and Gould, in support of the then proposed National Banking Act.
“The great body of the people, mentally incapable of comprehending the tremendous advantages that capital derives from the system, will bear its burdens without complaint and perhaps without even suspecting that the system is inimical to their interests.”
John Sherman hit the nail on the head. And the beauty of central bank control over the volume of currency and credit is that Karl Marx considered this crucial in his 1849 Communist Manifesto. So, even left-leaning academics and Obama supporters bear the Federal Reserve’s burden without complaint.
Today, there are few who advocate using gold as money. However, that will change in the not too distant future. Look at the table in the chart below. Currency in Circulation (CinC), freed from the discipline of the gold standard, has increased from $3.96 billion in 1925 to $1,379 billion today, an increase of 34,800% over the past ninety years. The Dow Jones dividend payout during the same period increased by only 6,700%, far less than the rate of inflation. The difference benefitted only the patrons of the Federal Reserve: Washington’s politicians and Wall Street’s bankers. However, dividends still provided investors some compensation for inflation. Bonds with their fixed income did not, or ever will.

But dividends are a double-edged swor
