Get 40% Off
👀 👁 🧿 All eyes on Biogen, up +4,56% after posting earnings. Our AI picked it in March 2024.
Which stocks will surge next?
Unlock AI-picked Stocks

Sterling Looks To Profit On USD's Back

Published 04/22/2014, 10:53 AM
Updated 07/09/2023, 06:31 AM

Talking Points
  • US DOLLAR testing uptrend from April low.
  • GBP/USD at topside of multi-month ascending triangle.
  • Forex economic calendar focuses on US housing data on Tuesday.

Yesterday we examined some of the causes behind the US Dollar’s weak start to 2014, which has largely bucked consensus expectations given the widespread belief that US Treasury yields would rise amid the Federal Reserve’s tapering of QE3. Today, the technical vulnerability of the US Dollar Index is revealed via the Dow Jones FXCM Dollar Index, an equal-weighted basket of the US Dollar versus the Austrailian Dollar, British Pound, Euro, and Japanese Yen.

Specifically, if the US DOLLAR is on the verge of another downswing, the GBP/USD may be best positioned to take advantage of it going forward:
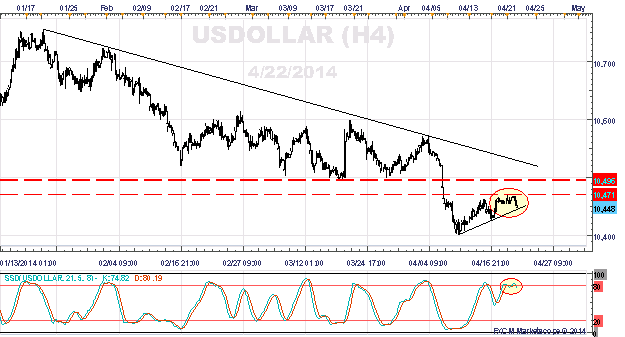
US DOLLAR: (H4)

  • US DOLLAR treated 10495/500 as significant support from February to April, before breaking on April 6.
  • Post-breakdown resistance has formed at 10470/75 and 10495.
  • The uptrend off of the April 10 and 17 lows is currently being tested; a move below 10425 would suggest resumption of the downtrend; below 10400 would confirm it.
  • Only a weekly close through 10495/500 would suggest USDOLLAR strength, also representing the descending trendline off of the January, February, and April highs.
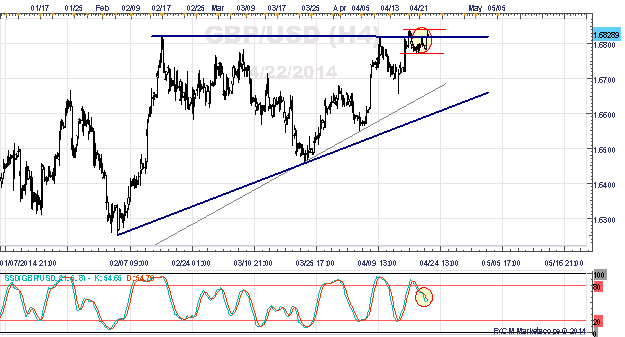
GBP/USD: (H4)

  • GBP/USD may be in the midst of a two month long ascending triangle formation, beginning back at the lows seen on February 4 to 7.
  • Resistance in the triangle formed against $1.6825, with the most recent failures coming after April 9.
  • There have been a series of higher lows forming above the ascending trendline off of the July 2013 and March 2014 lows, suggesting increasing bullish momentum.
  • The past three days price has consolidated into a minor flag (red) between 1.6773 and 1.6840 – these levels mark either side of the range to engage should a breakout opportunity arise. A move through 1.6840 would immediately draw attention for a move towards 1.7000.

--- Written by Christopher Vecchio, Currency Analyst

3rd party Ad. Not an offer or recommendation by Investing.com. See disclosure here or remove ads .

Latest comments

Risk Disclosure: Trading in financial instruments and/or cryptocurrencies involves high risks including the risk of losing some, or all, of your investment amount, and may not be suitable for all investors. Prices of cryptocurrencies are extremely volatile and may be affected by external factors such as financial, regulatory or political events. Trading on margin increases the financial risks.
Before deciding to trade in financial instrument or cryptocurrencies you should be fully informed of the risks and costs associated with trading the financial markets, carefully consider your investment objectives, level of experience, and risk appetite, and seek professional advice where needed.
Fusion Media would like to remind you that the data contained in this website is not necessarily real-time nor accurate. The data and prices on the website are not necessarily provided by any market or exchange, but may be provided by market makers, and so prices may not be accurate and may differ from the actual price at any given market, meaning prices are indicative and not appropriate for trading purposes. Fusion Media and any provider of the data contained in this website will not accept liability for any loss or damage as a result of your trading, or your reliance on the information contained within this website.
It is prohibited to use, store, reproduce, display, modify, transmit or distribute the data contained in this website without the explicit prior written permission of Fusion Media and/or the data provider. All intellectual property rights are reserved by the providers and/or the exchange providing the data contained in this website.
Fusion Media may be compensated by the advertisers that appear on the website, based on your interaction with the advertisements or advertisers.
© 2007-2024 - Fusion Media Limited. All Rights Reserved.